Even though we had to conclude in our May blog article that the Sell in May rule has little significance regarding returns, market activity over the summer is usually quieter and less surprising. The movement of the first half of the year continues or pauses, but new impulses rarely emerge. Only at the end of August and in September does liquidity and activity in the markets increase, as fund managers and professional investors position themselves for the second half of the year. This period is therefore also typically more volatile and intense. Usually, the time has now come to keep a closer eye on the markets.
The position of the stock indices is also a good reason to look very closely. We will get somewhat more technical in this article and look under the hood of the market. So for those who find this too detailed, the short version: It is at least time to follow the market more actively and some caution is certainly advisable. Why?
State of Affairs
Let's first take a look at where the market actually stands now. At the beginning of the year, we considered the movement of the last six months probable, although we didn't expect it to be so steep and consistent. Here again is the trend channel from back then compared to the current state.
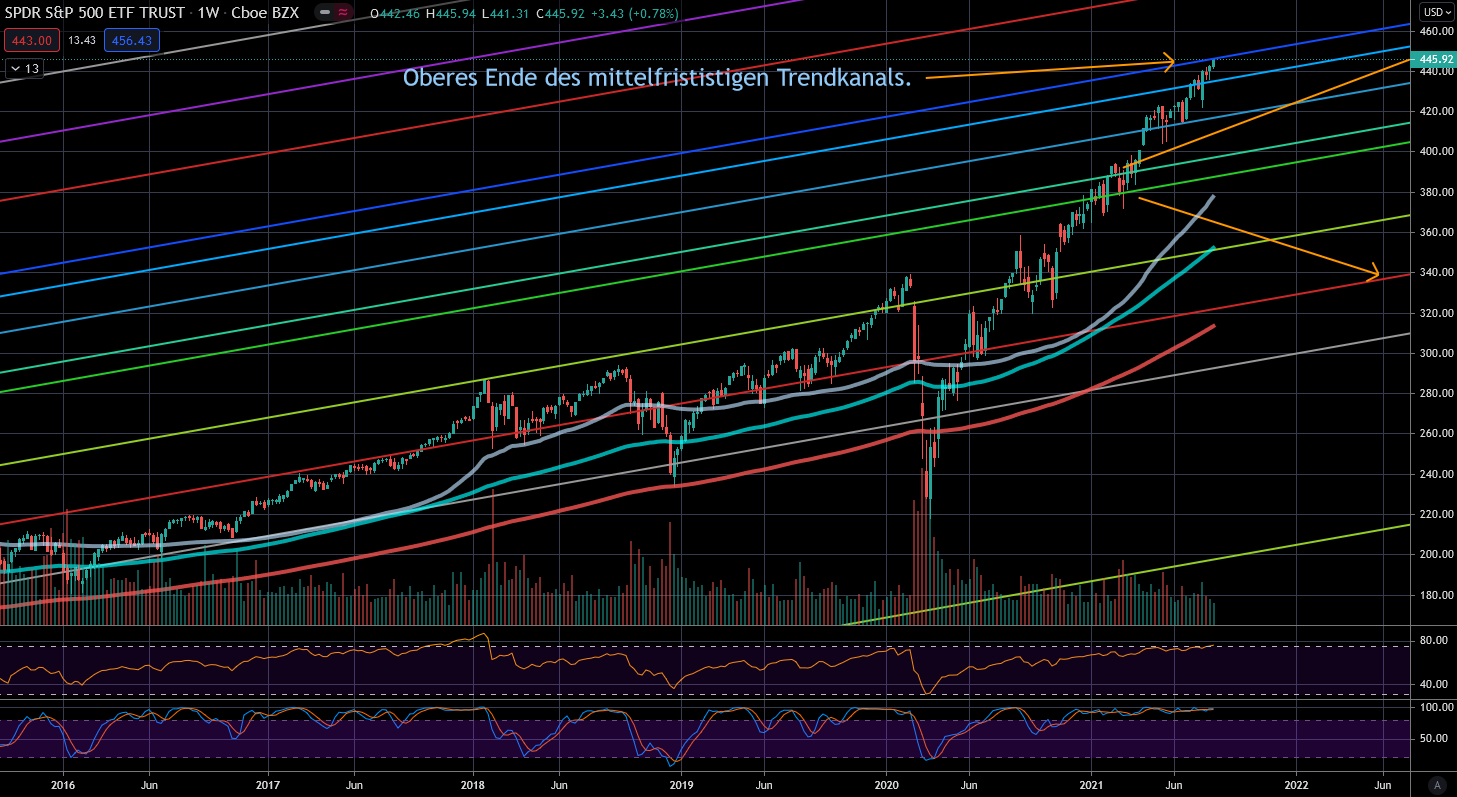
As of Friday, the S&P 500 has thus reached the upper end of the trend channel, after the boundary was confirmed in the short fluctuations around February and May. These boundaries carry weight and thus the current position of the index also fits the timing. The big question for the coming weeks and the rest of the year is: can the index advance to the next higher region or will it remain in the channel. In the latter case, the trading range would be limited to approximately 400 - 460 $ or 4000 to 4600 points in the S&P 500 and the upward movement along the dark blue trend line would be over in the medium term. A look at the short-term hourly chart shows once again the significance of the line:
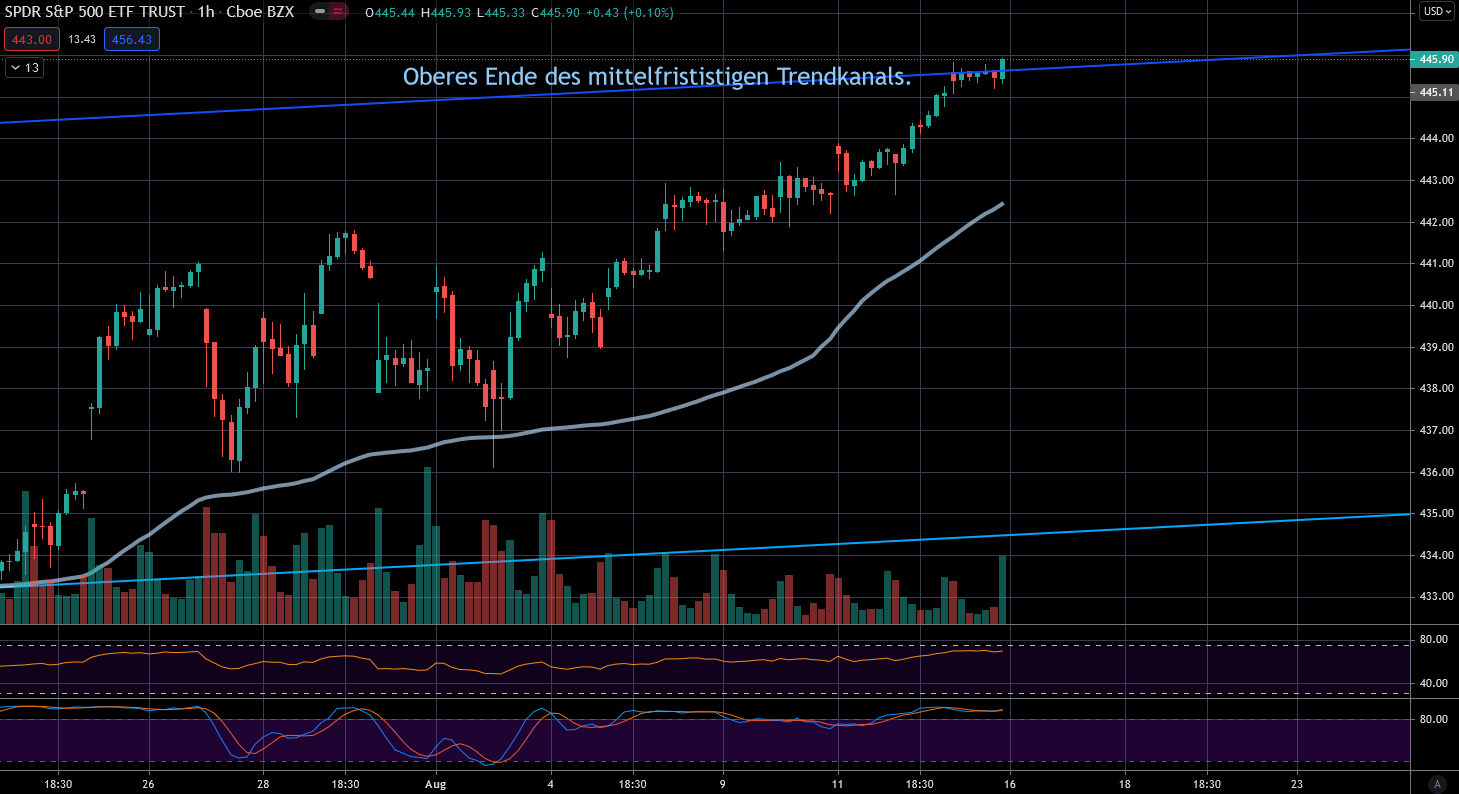
On Friday, the market opened directly at this line, struggled with it during the trading day, and finally broke above it with the closing auction. But whether this breakout will last is very doubtful.
Risk
While the dynamics of the movement over the last six months demonstrate significant upward pressure, such pressure often reverses when the wind shifts. The risk of a shifting wind is uniquely high. For this, we look at the CBOE SKEW Index:
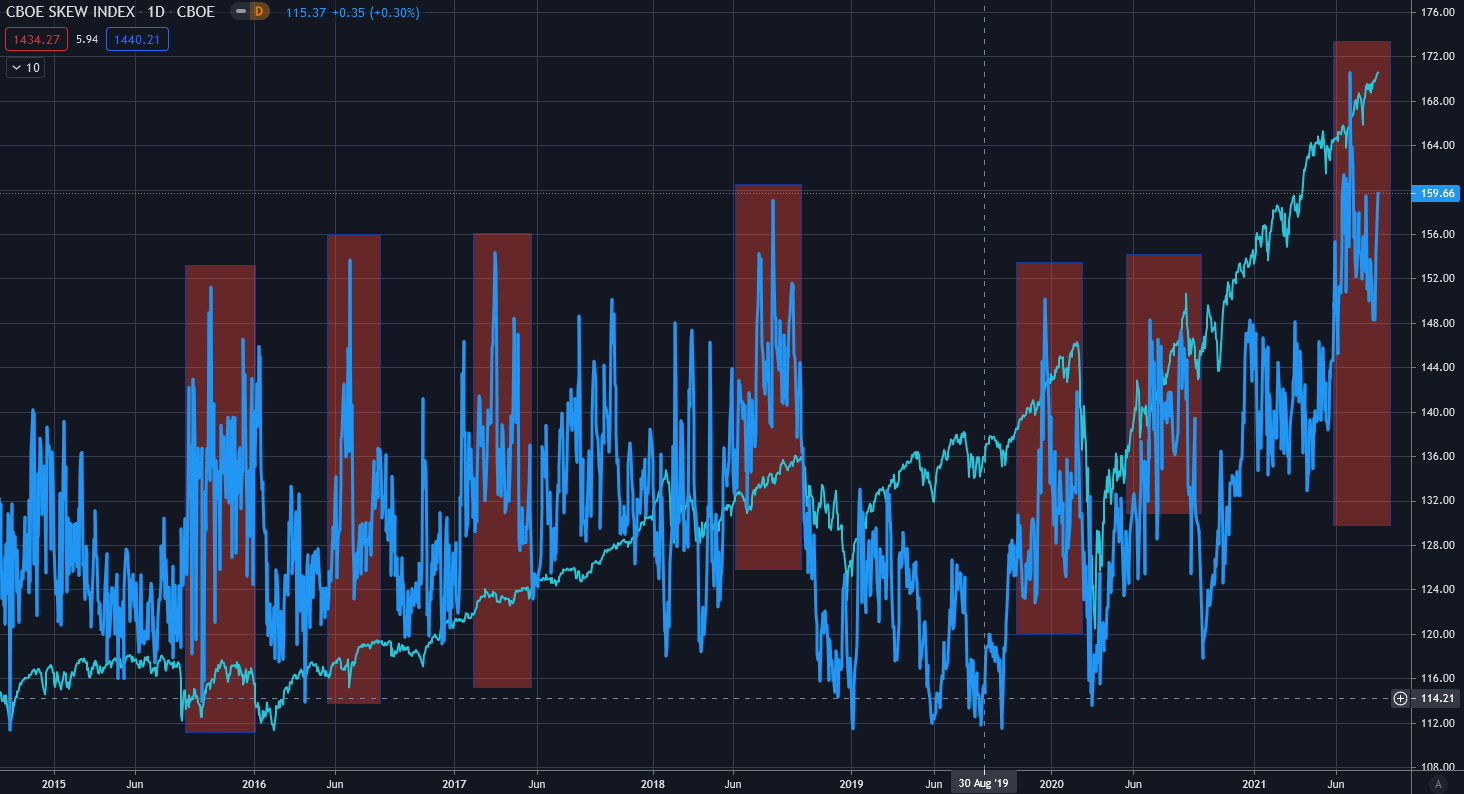
The SKEW Index (blue vs. S&P 500 turquoise) can also be aptly called the Crash Risk Index. It indicates how "skewed" the positioning in the market is. A skewed positioning means that extraordinary movements become more likely, so-called tail-risk events. So ultimately it's simply an indicator for unpleasant surprises. It's important to note that they only become more likely, not likely. The chart shows that both the Corona crash and the 2018 trade war were preceded by a spike in the SKEW Index. However, there were also 4 occasions with similar behavior where nothing happened. Nevertheless, one should be aware that the probability of negative surprises is currently as high as it hasn't been in a decade. To determine how negative the surprise can be, one must look at the volatility index:
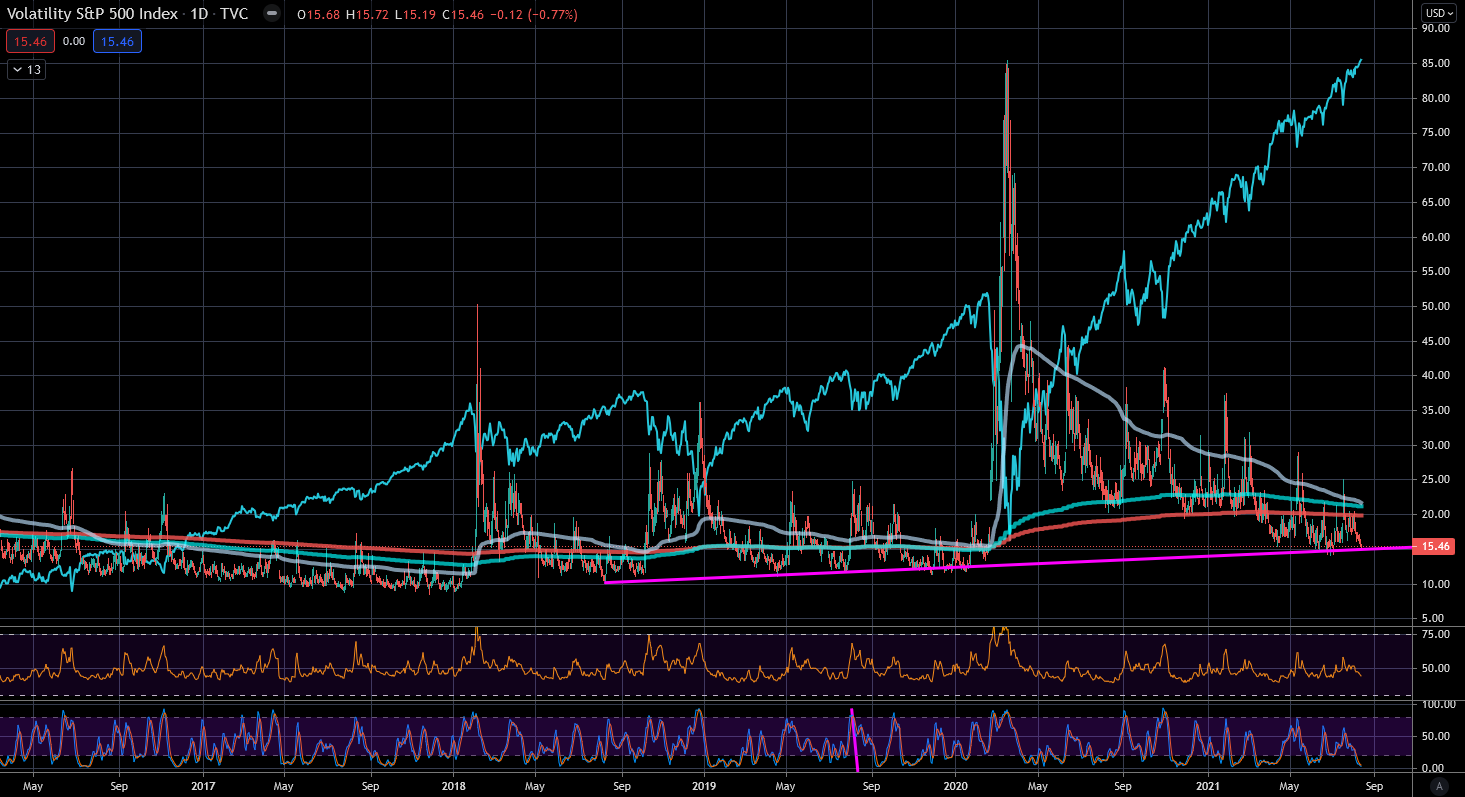
A low VIX value indicates a calm market. The lower the value, the smaller the "more probable" negative surprise indicated by the SKEW Index (more on this here). Currently, the VIX is quite low but not very low. Moreover, the VIX is struggling at the trend line (pink) of the last 5 years. Another puzzle piece indicating we are at a critical point. If the S&P can establish itself above the blue trend line from above, the VIX should also fall below the pink line in this chart. Conversely, from this position the market can also wonderfully start a correction of 10% - 20%. And the SKEW Index considers this unusually likely.
Ready for Better Investment Decisions?
Start your free trial today - stock analysis with artificial intelligence.
Full Transparency | Full Access | Cancel anytime
Economy
This behavior definitely has reasons from a macro perspective. A look at my US Economy Indicator:
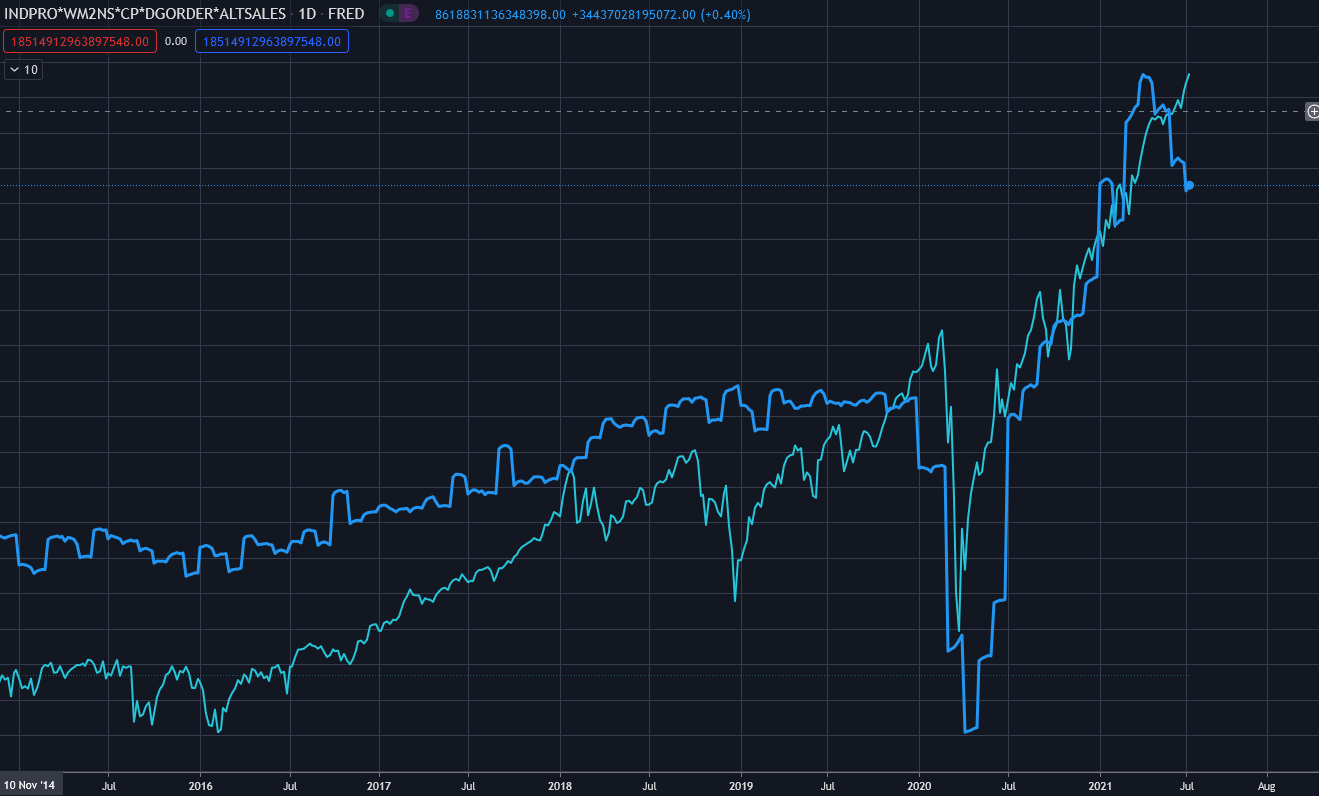
In blue we see a segment of the American economy normalized by the money supply. This includes, for example, industrial production and order backlog. Ultimately, this line is a reflection of the economic and purchasing power of American society and economy. Typically, this measure behaves very similarly to the development of the stock market, and since Corona, the recovery in the stock market has been fully supported by the recovery in this picture. Over the summer, however, the economic indicator dropped drastically while the stock market detached itself from reality. An important reason for the decline is rising inflation and the resulting stricter monetary policy. This topic will certainly accompany us in the near future. Finally, a look at the Russell 1000, the broad index for American small and mid-caps, which reacts very sensitively to the economic situation:
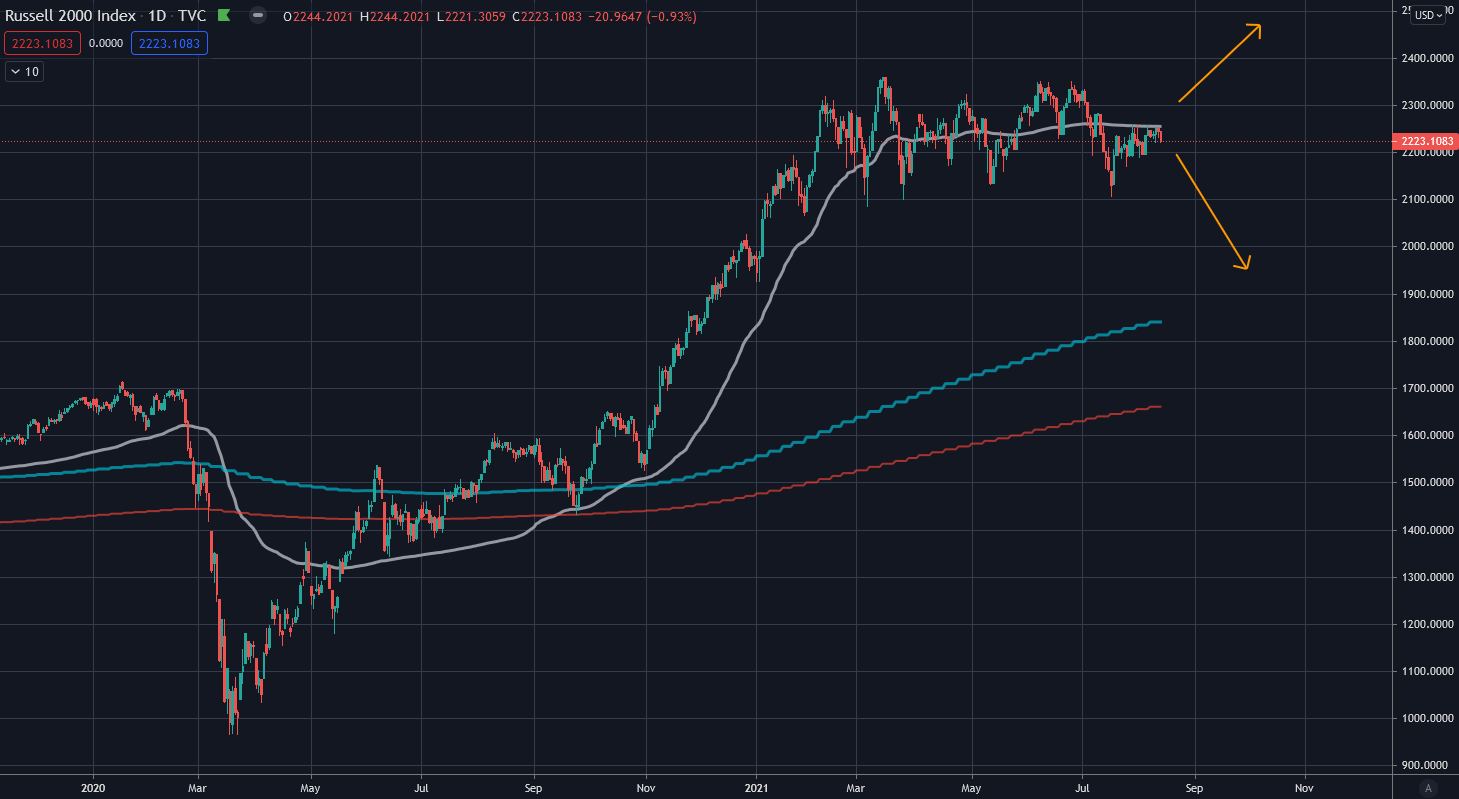
A significantly more adapted picture to the American economic situation and also again at a critical position. Particularly on Friday, it bounced off the gray moving average, while the S&P pushed above the trend line.
Conclusion
So actually everything is quite simple now. The risk is significantly elevated. We have identified critical marks for the S&P 500 (~4450) and the VIX (~15), which are supported by the Russell. If these marks can sustainably fall, meaning not just be breached once but confirmed through retests, then the market enters another acceleration phase and we most likely face further strong years ahead. If the market fails here, a 20% correction or even a long consolidation phase is likely.
The biggest difficulty now is not to act hastily and change opinions at every opportunity. Phases of direction-finding are logically characterized by many changes in direction. Ultimately, the market finds its direction by trying both possibilities until one side prevails. Therefore, here's a look back at the direction-finding phase from the beginning of the year, at the end of which stood the rally of the last 6 months:
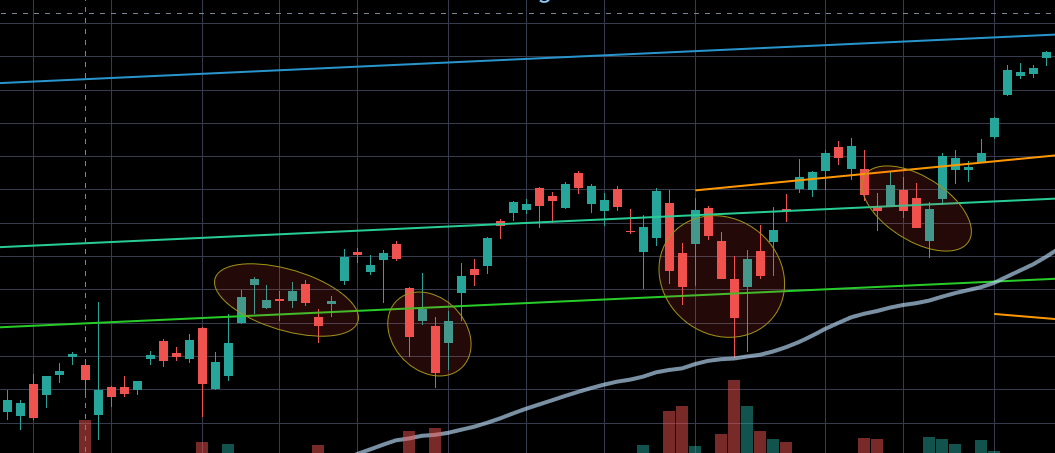
The marked areas show typical points where one becomes uncertain in the process of direction-finding. Shortly before the first mark, it was clear that a decision phase was approaching, just like now. Subsequently, everything seemed fine and the breakthrough successful. Until then in the second marking, a serious downward attempt started and caused justified slight panic. It reversed just as quickly and the direction seemed clear again. But in the third marking, the bears made another attempt. Only here did the actual decision fall with the technically beautiful recovery from the moving average. This decision was then confirmed in the fourth marking by approaching the area of decision-finding and finding buyers here. Only after this process from the beginning of January to the end of March did the dynamic movement start that has carried us until now.