Leeway Market-Fit Rating
Factor investing that learns from history and automatically adapts to the market – instead of fixed rules for all, it uses optimal ranges for each company type.

What is factor investing?
The scientific foundation for systematic stock selection
Before we show you how Leeway Market-Fit Rating works, let's first look at what factor investing actually is and why classical approaches often reach their limits.
The Basic Principle
Factor investing is based on the insight that certain fundamental properties of companies systematically correlate with better returns.
Examples:
- Value Factor: Cheaply valued stocks (low P/E) perform better long-term
- Quality Factor: Companies with high margins and stable growth are superior
- Momentum Factor: Stocks with positive price development often continue
The Problem: These factors don't always work the same way. They are context-dependent and change with the market regime.
The Challenge
Classical factor investing has three central weaknesses:
- Rigid Rules: A P/E of 15 is equally "good" for all industries – whether tech or utilities
- Linear Assumptions: Higher margins automatically mean better performance (ignores an optimum in the moderate range)
- Manual Adjustment: When regimes change between Value and Growth, you must manually adjust your strategy
The Result: Many factor strategies only work in certain market phases and fail when the environment changes.
Classical vs. Adaptive Factor Investing
Now you understand the basics. But how does Leeway Market-Fit Rating solve the problems of classical factor investing? Here you see the direct comparison:
Classical Factor Investing
Works with fixed thresholds:
- Rigid Rules: A debt ratio of 50% is rated the same for all industries – whether tech startup or energy provider
- Linear Assumptions: Higher margins automatically mean better performance. That extremely high margins can attract competition is ignored
- One Size Fits All: A P/E of 25 for a software company is treated the same as for a steel producer
- Manual Adjustment Required: When the market switches from Value to Growth, you must manually adjust your factors
- Overlooks Sweet Spots: That moderate debt is often better than none at all, the system doesn't recognize
Leeway Market-Fit Rating
Learns continuously from actual market data:
- Historical Analysis Instead of Rules of Thumb: We examine for each factor: What actually worked in the last 4 years? At which debt ratio was the return highest and most stable? Scores are calculated through weighted averages of recent years plus forecasts.
- Finds Optimal Ranges: Often the optimum is in the middle – too little and too much debt are both suboptimal. The system automatically recognizes these sweet spots
- Compares Only Similar: Software companies are only compared with software companies, European mid-caps only with European mid-caps
- Automatically Adapts: Every three months, optimal ranges are recalculated – based on current market patterns
- Recognizes Regime Changes: When the market switches from Value to Growth, the weighting automatically shifts
The 18 Fundamental Metrics
Evenly distributed across three factor groups – each is adaptively optimized
Market-Fit Rating analyzes 18 fundamental metrics divided into three groups. Each group is separately and adaptively optimized – meaning optimal ranges are determined individually for each factor.
Profitability
How profitably does the company operate?
These metrics show how efficiently a company generates profits. High margins and returns are often a sign of competitive advantages.
Finance
How stable and growth-oriented is the company?
These metrics assess financial stability and growth potential.
Price-Performance
Is the stock fairly valued?
These metrics assess whether the stock price is appropriate.
The Methodology in Detail
You now know which metrics are analyzed. But how does adaptive optimization work concretely? Here you learn step by step how Market-Fit Rating finds optimal ranges for each factor:
Form Peer Groups
The Problem: A dividend of 5% is not unusual for a utility like RWE, for a software company like SAP it would be extremely high.
The Solution: We group by industry × country × company size. SAP is compared with other European software corporations.
Quality Assurance: At least 50 companies per group so statistics are reliable.
Recognize Historical Patterns
The Question: At which equity ratio was the return best – and how reliable was it?
We divide each metric into ranges and analyze these over 4 years:
- Average Return incl. dividends after one year
- Hit Rate: How often was performance positive?
- Stability: How much did results fluctuate?
Find Optimal Ranges
Example Debt: No debt? You may be missing growth opportunities. Too much debt? Bankruptcy risk increases. Often the sweet spot is in the middle.
The Algorithm finds for each factor and each peer group the range with the best combination of return, hit rate and stability.
Protection Against Overfitting: A rolling time window prevents hindsight bias. The data decides – without human prejudices about which patterns should be "plausible".
Continuously Recalibrate
Rolling Time Window: Always the last 4 years are considered. New quarterly data is added, the oldest falls out.
Score Calculation:The Market-Fit Rating values are determined through a weighted average of recent years plus a forecast. Newer data is weighted more heavily than older.
Smoothing: This prevents short-term market distortions from skewing the assessment.
The Result: When the market switches from Value to Growth, the weighting automatically shifts – without you having to intervene manually.
Now test Market-Fit Rating in screening
Open the ranking and sort by Market-Fit Rating.
To Screening14 days free trialPractical Example: SAP SE
This is what the assessment looks like concretely
Data from: 10/2025
Theory is good, practice is better. Let's see how Market-Fit Rating works with a concrete company. SAP SE serves as an example here to show why adaptive factor investing often comes to different results than classical approaches.
SAP SE – Software Corporation
EBITDA margin of 13.7% is in the optimal range for European software corporations
Solid revenue growth and appropriate distribution
P/E of 88 – attractive for software companies with this quality
The Key Difference
Classical factor investing would classify SAP as overvalued:"A P/E over 30 is too expensive"
Market-Fit RatingMarket-Fit Rating recognizes: For a European software company with this market value, a P/E of 88(!) is in the optimal range.
A P/E between -10 and 10 was a reliable indicator of poor returns.
Strengths: Solid margins and constant growth
Weaknesses: Conservative debt
Market-Fit Rating is one of three scores
All three flow equally weighted (each ⅓) into the Leeway Score
Market-Fit Rating is only part of the big picture. To give you a complete picture, we show you how Market-Fit Rating is embedded in the larger Leeway system and what role the other scores play.
Business Rating
AI analysis of the business model
Market-Fit Rating
18 fundamental metrics, adaptiv
Cycle Rating
Valuation vs. own history
Application in Practice
Now you know how Market-Fit Rating works. But how do you use these insights in your investment process? Here we show you the practical application possibilities:
1. Screening: Find
Use Ranking:Sort by Market-Fit Rating or individual sub-factors like profitability, finance or price-performance.
Combine Filters: Narrow down by countries or sectors and sort by score – this quickly creates a focused shortlist.
2. Individual Stock: Understand
In the individual stock view you see all 18 factors with their current values. Click on a factor:
- Time Series: Development over several years
- Optimal Band: Where is the historically best range? Where does the company currently stand?
- Strengths & Weaknesses: Which factors are in the green range, which are not?
3. Timing: Combine Cycle Rating
High Market-Fit Rating: The company shows structural quality and fits well with the current market environment.
High Cycle Rating: The valuation is historically favorable – a good entry point. If both scores are high, this results in a particularly attractive risk-reward ratio.
4. Compare: Peer Group
Use Peer Group: Automatically suggested alternatives from the same cluster.
Comparison Table: Direct side-by-side comparison of factors and scores.
Full Transparency
You don't just see scores – you understand the logic
An important principle of Leeway: No black box. You should not only see the scores, but also understand why a company is rated this way. Here you learn what information is available to you:
What You See in the Individual Stock View:
- Raw Value with Score: For example "P/E: 15.2 corresponds to 78 points"
- Time Series: Development of the metric over several years
- Optimal Band: Where is the historically best range?
- Peer Distribution: Bar chart – which range delivered the best combination of return, hit rate and stability in the past?
- Calculation: Scores are based on weighted averages of recent years plus forecasts
- Clickable: In the individual stock view you can expand each factor and view the details
Score Rating:
Market-Fit Rating ranges from -100 to +100.
Important: A negative score expresses the expectation of absolute negative performance on an annual basis. Limits are cluster-specific and are recalibrated quarterly.
How to Read the Factor Charts
Interactive Analysis: See how each factor relates to performance
The charts are the heart of transparency. Here you see not only current values, but also historical relationships. Learn how to optimally use these interactive visualizations:
What Does the Chart Show?
Each bar corresponds to a group of similar companies
Companies are divided into ranges by the metric value. Example P/E:
- Bar 1: All companies with P/E from 0-10
- Bar 2: P/E from 10-15
- Bar 3: P/E from 15-20
- and so on...
Highlighted: The bar where the current company is located – you immediately see if you're in the optimal range.
5 Different Perspectives
With one click you switch between:
Combined assessment from return, hit rate and stability
Average annual return incl. dividends
How often was the 1-year performance positive?
How much did results fluctuate? (lower = more stable)
How many companies fall into this range?
Practical Example: P/E for European Software Companies
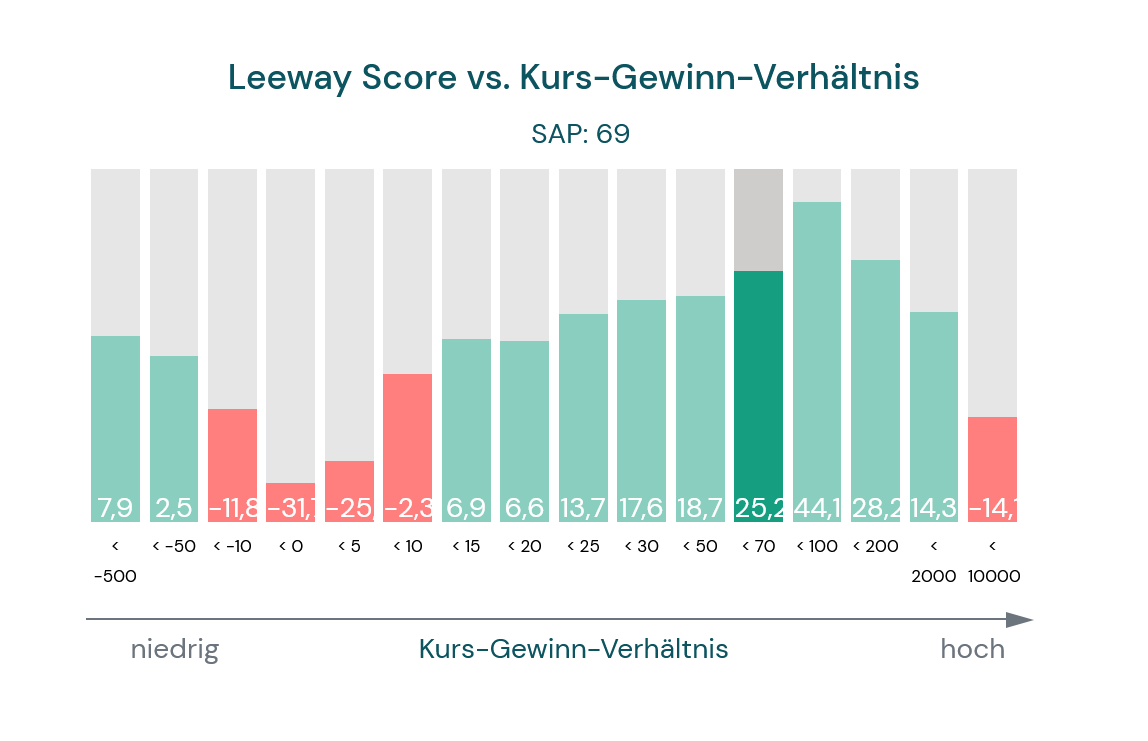
Interactive chart from individual stock view: SAP with P/E 69 in good range
What Do You See Here?
Example: SAP with a P/E of 69
- Highlighted Bar: P/E from 50-70 – this is where SAP currently stands
- Bar Height: Shows the average performance of this group over the last 4 years
- Comparison: You immediately see if lower or higher P/Es performed better
Typical Patterns You Can Recognize:
Higher values mean better performance (for example ROE, EBT margin)
Too low AND too high are suboptimal (for example debt, payout ratio)
Lower values mean better performance (for example P/E in value phases)
Where Do I Find the Charts?
In every individual stock view:
- Select a stock from screening
- Scroll to the Market-Fit Rating section
- Click on a factor in the table (for example "P/E" or "EBT margin")
- A detail view opens with both charts: time series + bar chart
- Or: Tab "Metrics Comparison" for all charts at a glance
Why Is This Important?
No Black Box – Full Transparency:
- Understand Instead of Blind Trust: You see exactly why a factor is rated well or poorly
- Context-Dependent: A P/E of 30 can be optimal for software companies, but fatal for steel producers
- Empirically Based: Not our opinion, but historical market data shows what worked
- Adaptable: Ranges are recalibrated quarterly – you always see current patterns
Frequently Asked Questions
Do you still have questions? Here you find answers to the most common questions about Market-Fit Rating and adaptive factor investing:
Classical factor investing works with fixed thresholds that apply equally to all companies. When the market regime changes, you must manually adjust your strategy.
Market-Fit Rating compares within peer groups (industry, country, size), analyzes historically what worked, finds optimal ranges instead of linear rules and automatically adapts every three months to new market patterns.
An Example: Debt. Many would say: "The lower, the better." However, reality is more complex:
- No Debt: You may be missing growth opportunities. Debt capital can leverage returns.
- Too High Debt: Bankruptcy risk increases and flexibility decreases.
- Moderate Debt: Often the sweet spot – enough leverage for growth, but controlled risk.
The algorithm finds these optimal ranges individually for each factor and each peer group – based on historical data, not linear assumptions.
That's a valid question. We've built in several protective measures:
- Rolling Time Window: Always the last 4 years are considered, no cherry-picking periods. The system doesn't know during training what happens afterwards.
- Three Criteria Simultaneously: Not just return counts, but also hit rate and stability. A factor must convince in all three dimensions.
- Data-Driven: The data shows us the patterns – without human assumptions about what should be "reasonable". Surprising relationships are also recognized.
- Discrete Ranges: We don't fit smooth curves, but analyze broad ranges (so-called buckets).
- Smoothing: Short-term outliers don't influence calibration.
Yes, automatically. The rolling 4-year window captures new market patterns. When the market switches from Value to Growth, the weighting automatically shifts within a few quarters toward growth factors.
In the transition phase (typically 1-2 quarters after a sudden change) it can be useful to additionally weight Business Rating and Cycle Rating more heavily.
Smoothing prevents short-term market distortions from skewing the assessment – at the same time the system is fast enough to recognize structural changes.
Two-Tier System:
- Continuously: New fundamental data flows in, scores for all companies are recalculated – based on current optimal ranges
- Quarterly: Optimal ranges themselves are recalibrated. The rolling 4-year window moves forward one quarter, new data is added, the oldest falls out
Avoiding Selection Bias: Excluding negative values would distort the distribution and overlook turnaround candidates.
Extreme Value Treatment: Winsorizing instead of removal – extreme outliers are limited to threshold values, but not deleted.
Yes, especially then. The score measures relative strength within the peer group. In crises and bear markets, companies with solid balance sheets, high margins and stable cash flows typically perform significantly better than weak competitors.
Market-Fit Rating shows structural quality. For timing, combine with Cycle Rating and our market analysis – this way you also see if the overall market provides tailwind.
View Charts Live – Open Metrics Comparison
Switch to the individual stock view and open the "Metrics Comparison" tab.
Open Example14 days free trialRelated Topics
PWP Leeway UG (haftungsbeschränkt)