A new year has dawned, a decade has ended and the situation is as usual unusual. The world is in the midst of a century epidemic. Unique measures to protect the population are being taken and have unforeseen impacts on public and especially economic life. Government debt continues to accumulate, the (former) American president will most likely have to answer in court regarding the call for violent seizure of power. One may call it the most amateurish coup attempt in recent history or simply shake one's head in bewilderment. These circumstances are unusual in any case.
Despite everything, the stock markets have been rising steadily since last spring. American indices are swinging from one new high to the next, the DAX broke through its previous high at the start of the year and the Stoxx 600 is also steadily approaching new heights. How does this fit together? Has the market completely detached itself from reality? Let's forget what we know or think and look neutrally at the data and charts.
Let's begin with a brief look at the global stock market in the form of the iShares All Country World Index ETF adjusted for the dollar price:
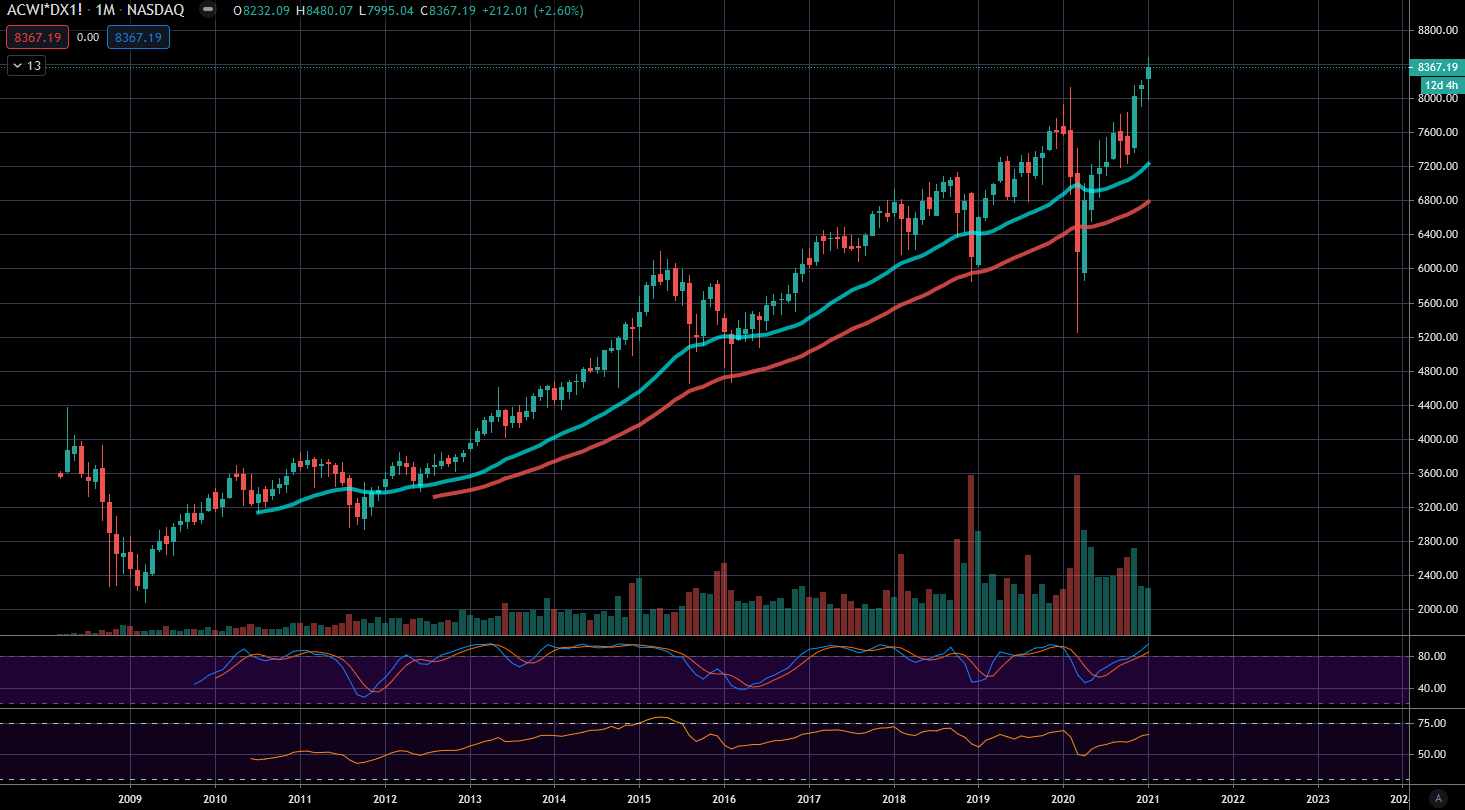
We see a global stock market that has been in a relatively steady upward trend since the financial crisis. Currently the price is more at the upper end of its usual range. In itself, however, it simply pushes upward by a good 8% per year and is not sustainably disturbed by either trade wars or pandemics.
For the long-term perspective we now look at the American stock market using the S&P 500.
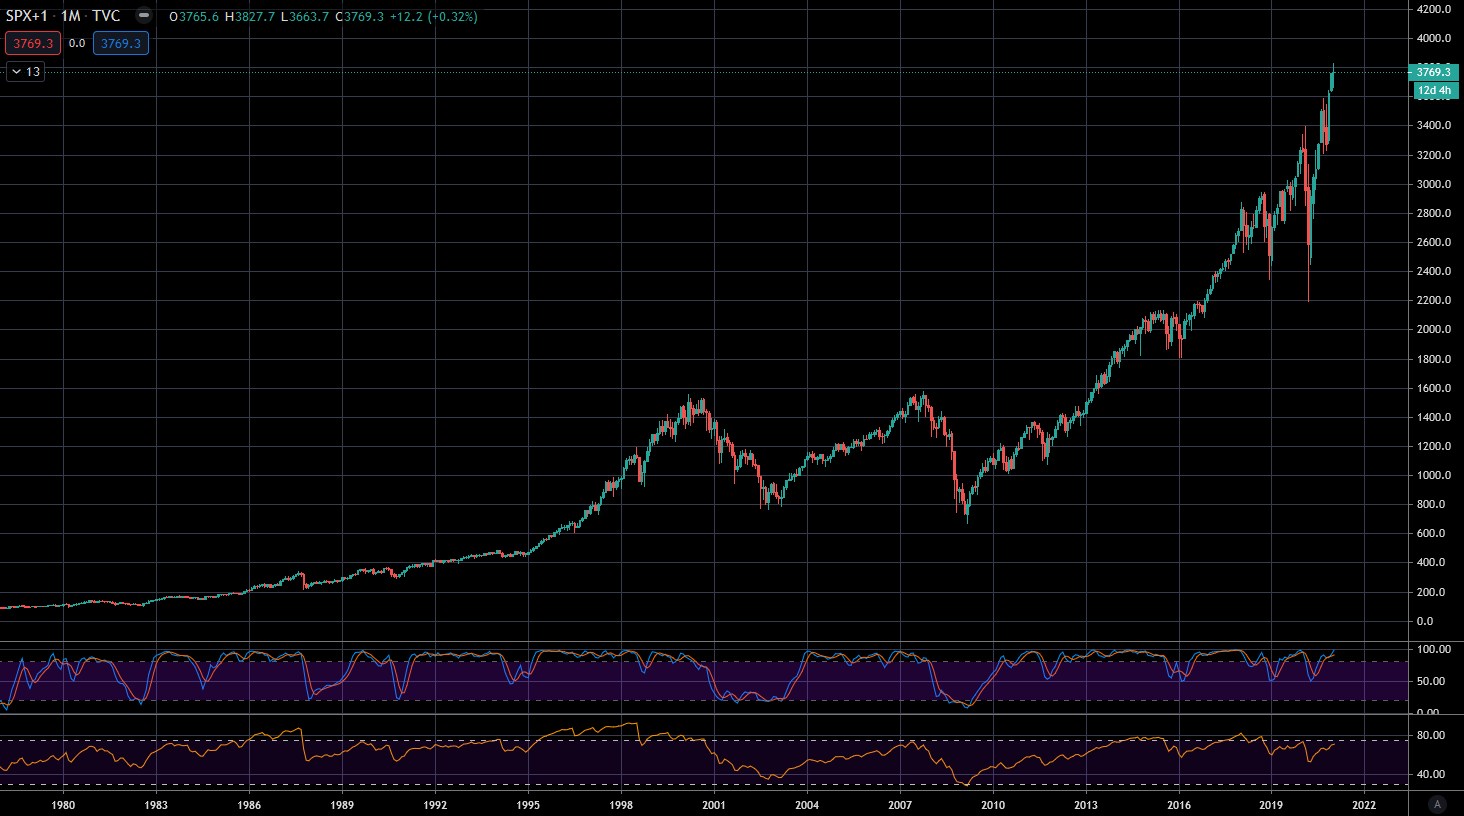
Clearly a market in a bubble and completely excessive valuations? This chart is deceptive, because in such a long history the compound interest effect is extremely strong and the later gains appear significantly higher than they actually are. In the logarithmic representation, which removes the cumulative effects of gains building on each other, a significantly different picture emerges.
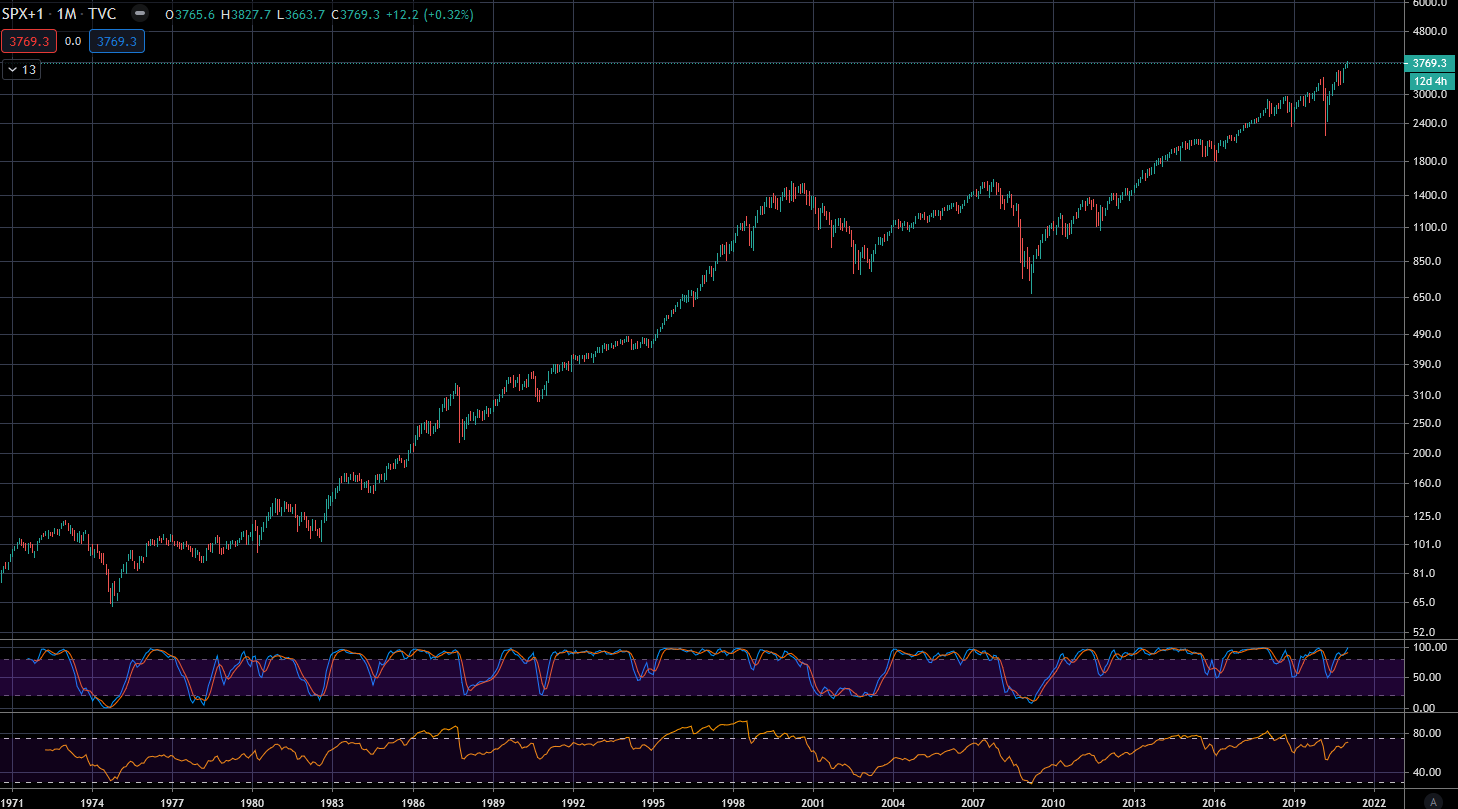
In the bull market from 1970 to 2000, the S&P rose at its peak by over 2000% and thus 13% per year over 25 years. Since the low point in 2009, however, the increase is "only" around 450% and without the compound interest effect we also see a quite normal, linear increase over the last 50 years. A repetition of the last bull market would therefore easily provide potential for another 300% to 400% and the "top" would then only be reached in 2033 at a level of 15000 points or 50000 points in the DAX.
The trend channel of the S&P is divided into three parts. In the upper part the bull market before the 2000s took place. Through the middle part it sagged during the interim rally until the financial crisis. Since then it has moved at the lower edge.
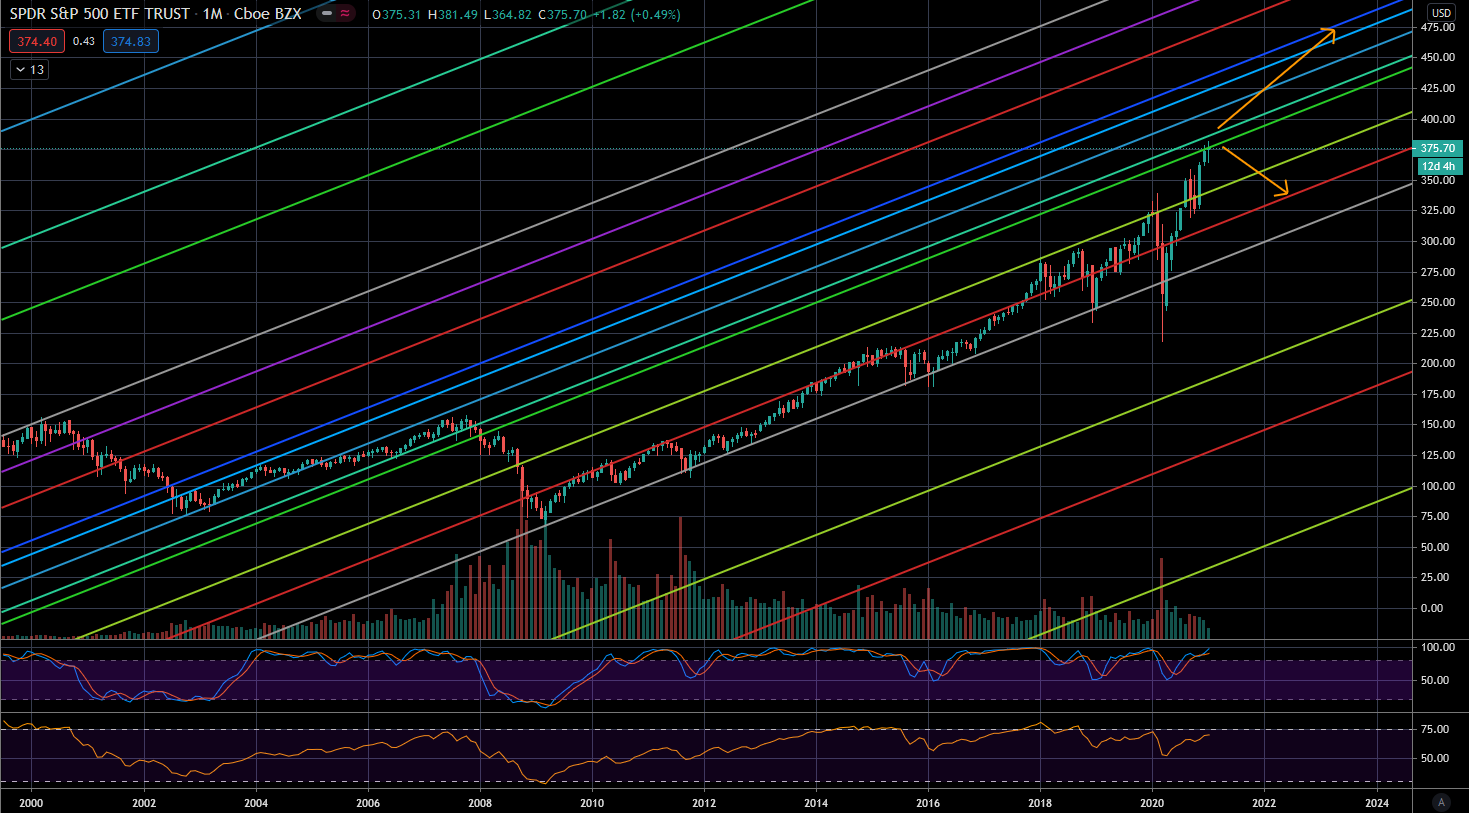
In the spring of last year everything looked as if the channel would break downward, but it turned out differently. After the extremely strong recovery we are now exactly at the crossroads between the lower and middle channel. If the market now manages to break upward and establishes itself above the dividing wall, that would technically confirm the acceleration and suggest further strong years ahead.
Ready for Better Investment Decisions?
Start your free trial today - stock analysis with artificial intelligence.
Full Transparency | Full Access | Cancel anytime
But is such sustainable development even possible? Which stocks should support it? A major problem of market internals in recent years was "Breadth", i.e. the breadth or the number of stocks that generated price gains. Most rested on the shoulders of the heavyweights: Facebook, Amazon, Apple, Google, Microsoft and a few others. Let's look at the breadth by examining the percentage of stocks that are above the 50, 100 and 200 day average:
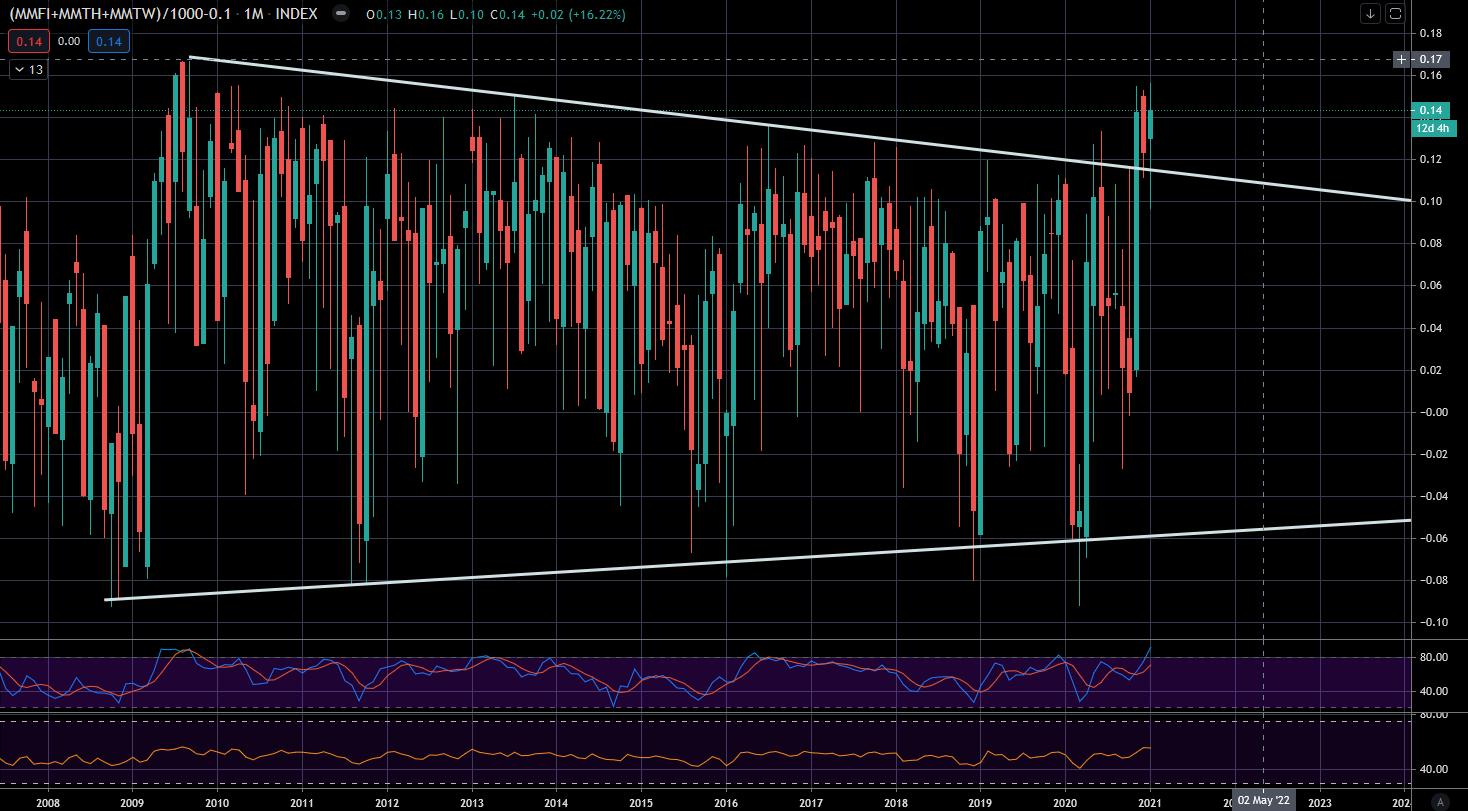
The downward trend since 2009 in the breadth of stocks participating in increases is clearly visible and was a major concern. In November last year, however, this ten-year trend was broken and the trend line was successfully tested both in December and January. A sign of a paradigm shift "upward", to a market that is supported by a broader mass of stocks in upward movements.
How can this development come about while the economy is suffering from restrictions and loss of orders? Corporate values and thus stock prices are also or especially determined by the available money supply and the central banks have put unprecedented amounts of money into circulation to cushion the effects of Corona. Ultimately money simply becomes less valuable and companies are worth more money. If we adjust measurement data of the (American) economy (car sales, corporate profits, new orders and industrial production) for the money supply in circulation and compare them with the S&P (turquoise line):
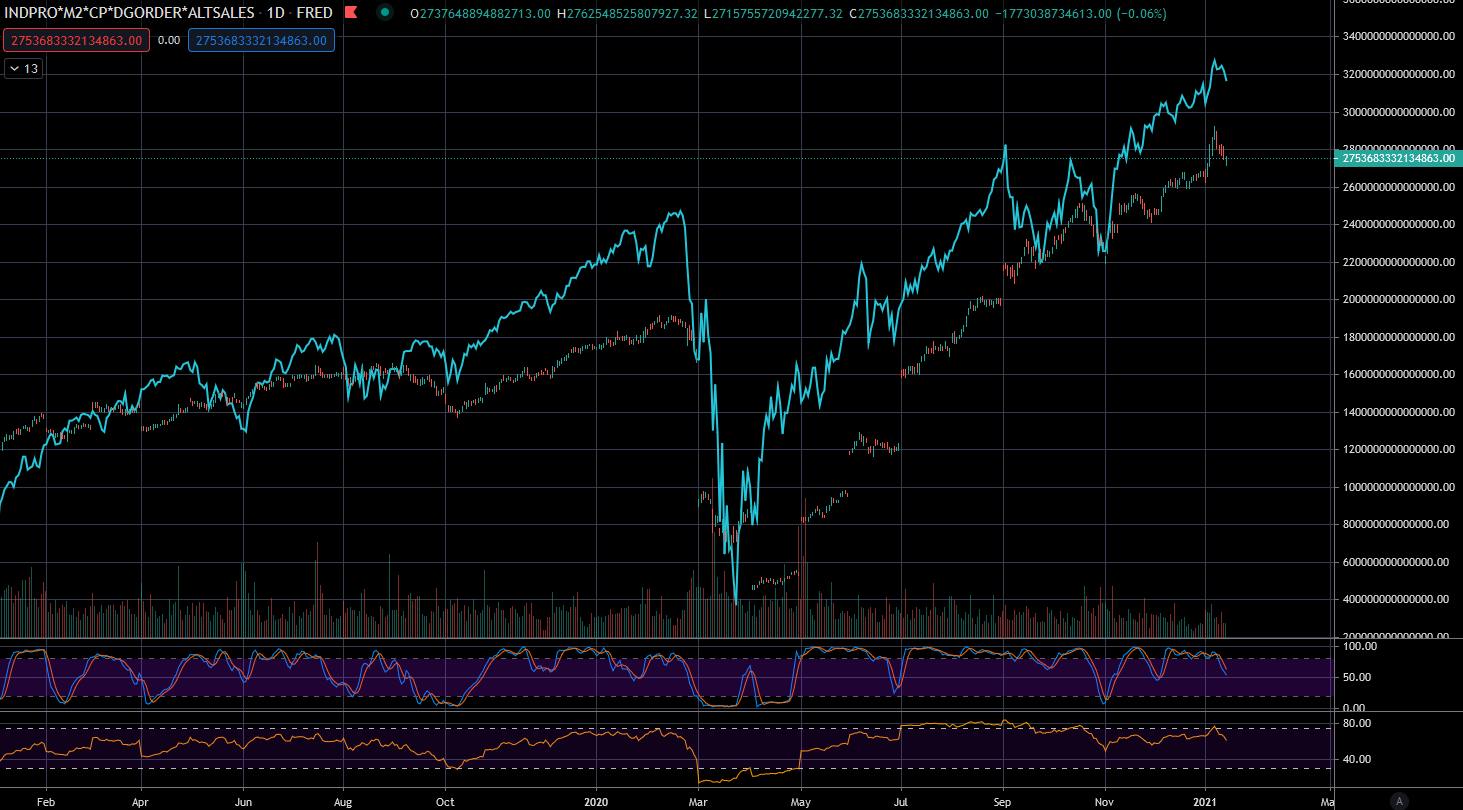
The expansion of monetary aid has more than made up for the economic losses due to Corona in proportion and the stock market is running somewhat ahead of the recovery, but ultimately moves with the economic and monetary development.
Of course the development of ever-increasing government debt is concerning and probably not sustainable. Of course it is not unlikely that there will be long-term consequences of the Corona crisis and economic development will suffer. No one knows whether further major misfortune is around the corner. One thing is certain: Much in market behavior points to a paradigm shift and the signs predominate that this shift leads to further upward acceleration and the incomprehensible strength of the market was rather born from an underlying strength that briefly paused in the Corona panic. Our market timing warned of overheated markets following the breakout in "Breadth" at the end of the year. This overheating has now subsided. Last week there was the first long-term buy signal in months and after two short-term warning signals for Thursday and Friday the needle is pointing again to a good buying opportunity for Monday.
Last but not least, Atoss has performed well after the recommendation in December and offers an opportunity to take profits.
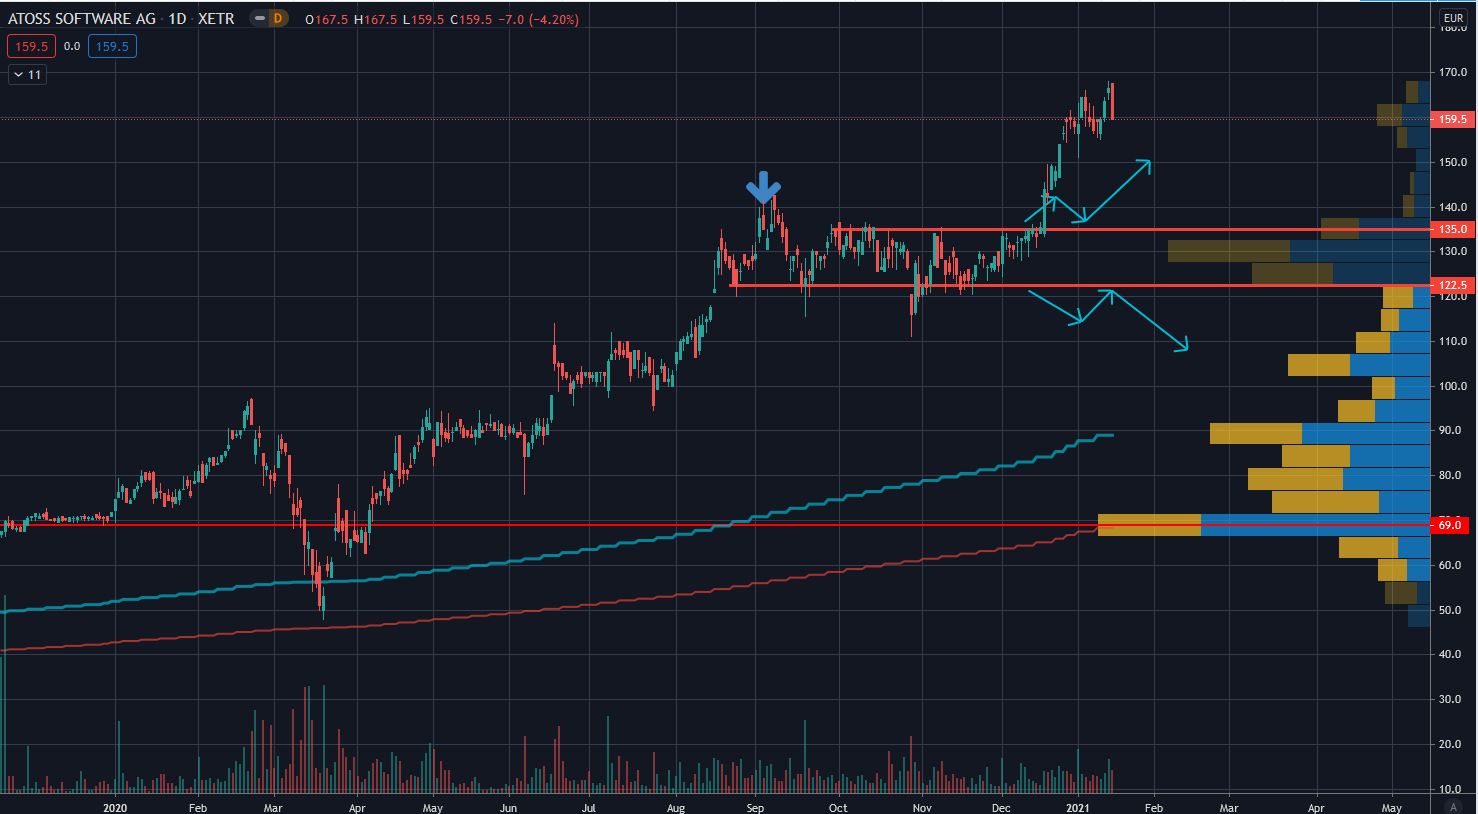
Lars Wißler owns shares of ATOSS Software AG. PWP Leeway does not own any of the mentioned stocks.