Sooner or later, you stumble across it every year: Sell in may and go away - come back in october. This is how you encounter it in news, analyses, forums, or even unexpectedly over a beer. How much truth is hidden behind this saying?
The idea behind this stock market wisdom lies in the summer break: Starting in June, vacation time begins, trading becomes somewhat slower and volume decreases. Many traders take a break and leave the field to the second string. The market runs more volatile, being less liquid, sideways and somewhat downward. Until early autumn when traders return and the trading desks are fully staffed again. Indeed, trading is significantly thinner during the summer months, so far, so true. But does this also have negative effects on price development?
We examined the price movements of the DAX and the S&P 500. For the DAX, we were able to look back on a good 30 years of history, for the American index on around 70 years. On the vertical axis the price development, on the horizontal axis the trading days from May:
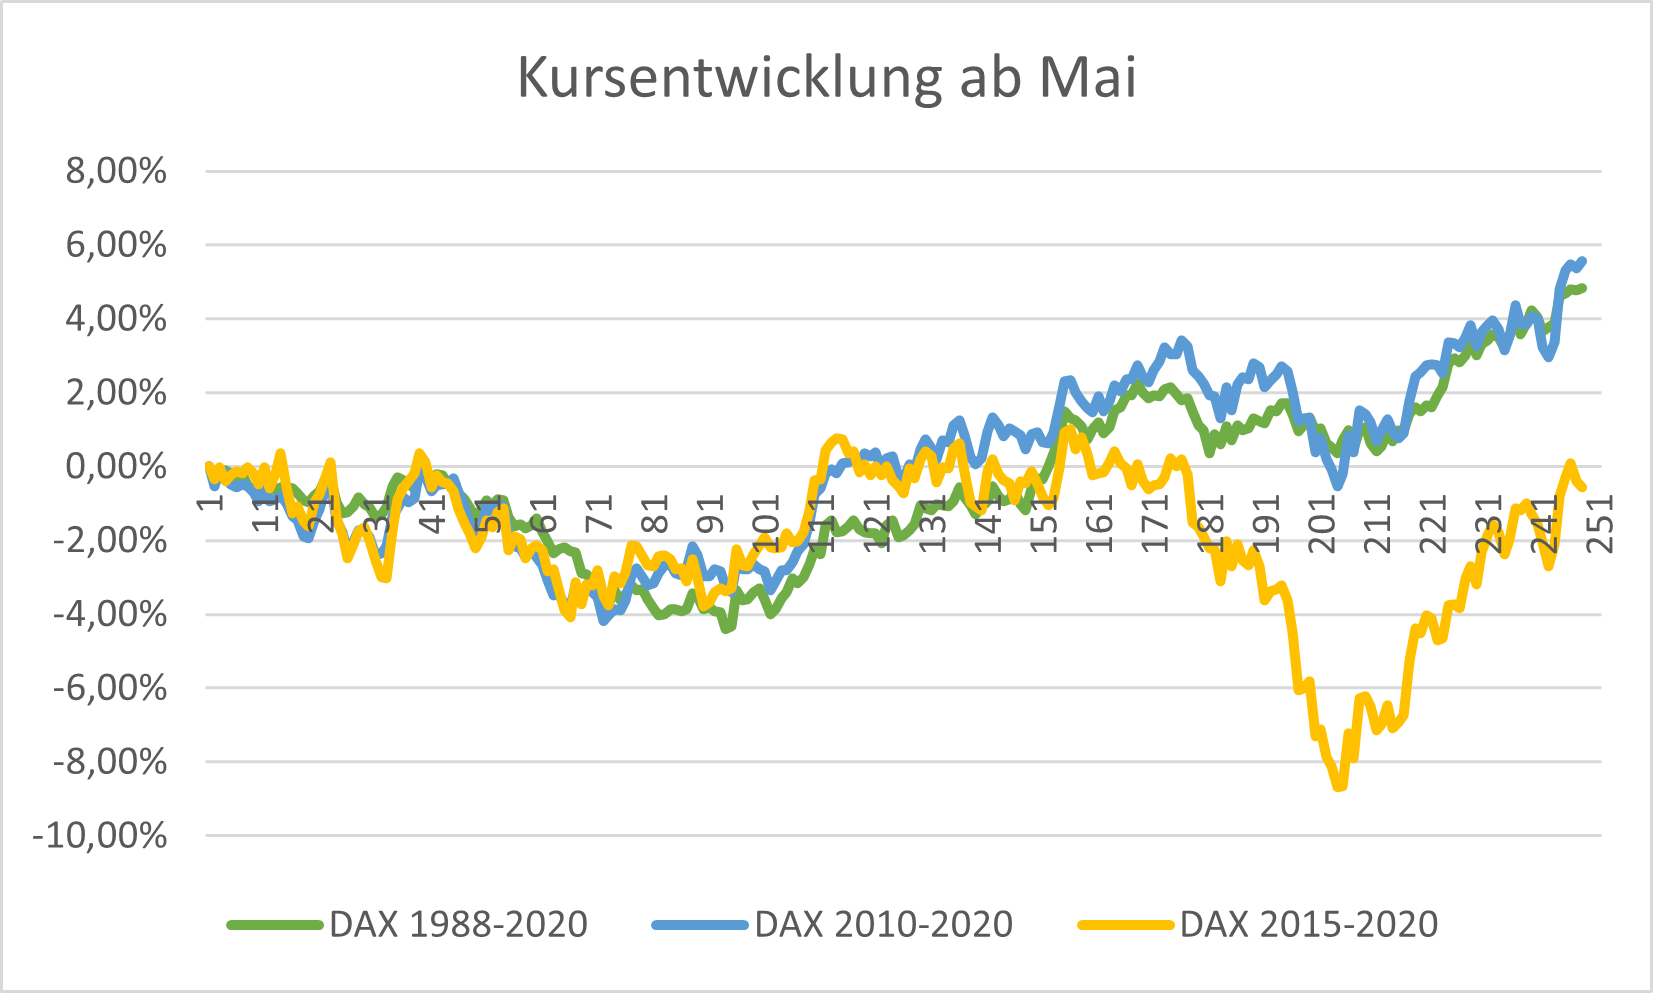
Average DAX movement from May to May
For the DAX, a rather weak development from May onwards is indeed recognizable. Both in recent years and over the past 30 years, the DAX fell on average around 4% from May to October (around 100 days) only to then rise by around 10% until the following May. The average movement of the last 5 years is clearly marked by Corona, more on that later.
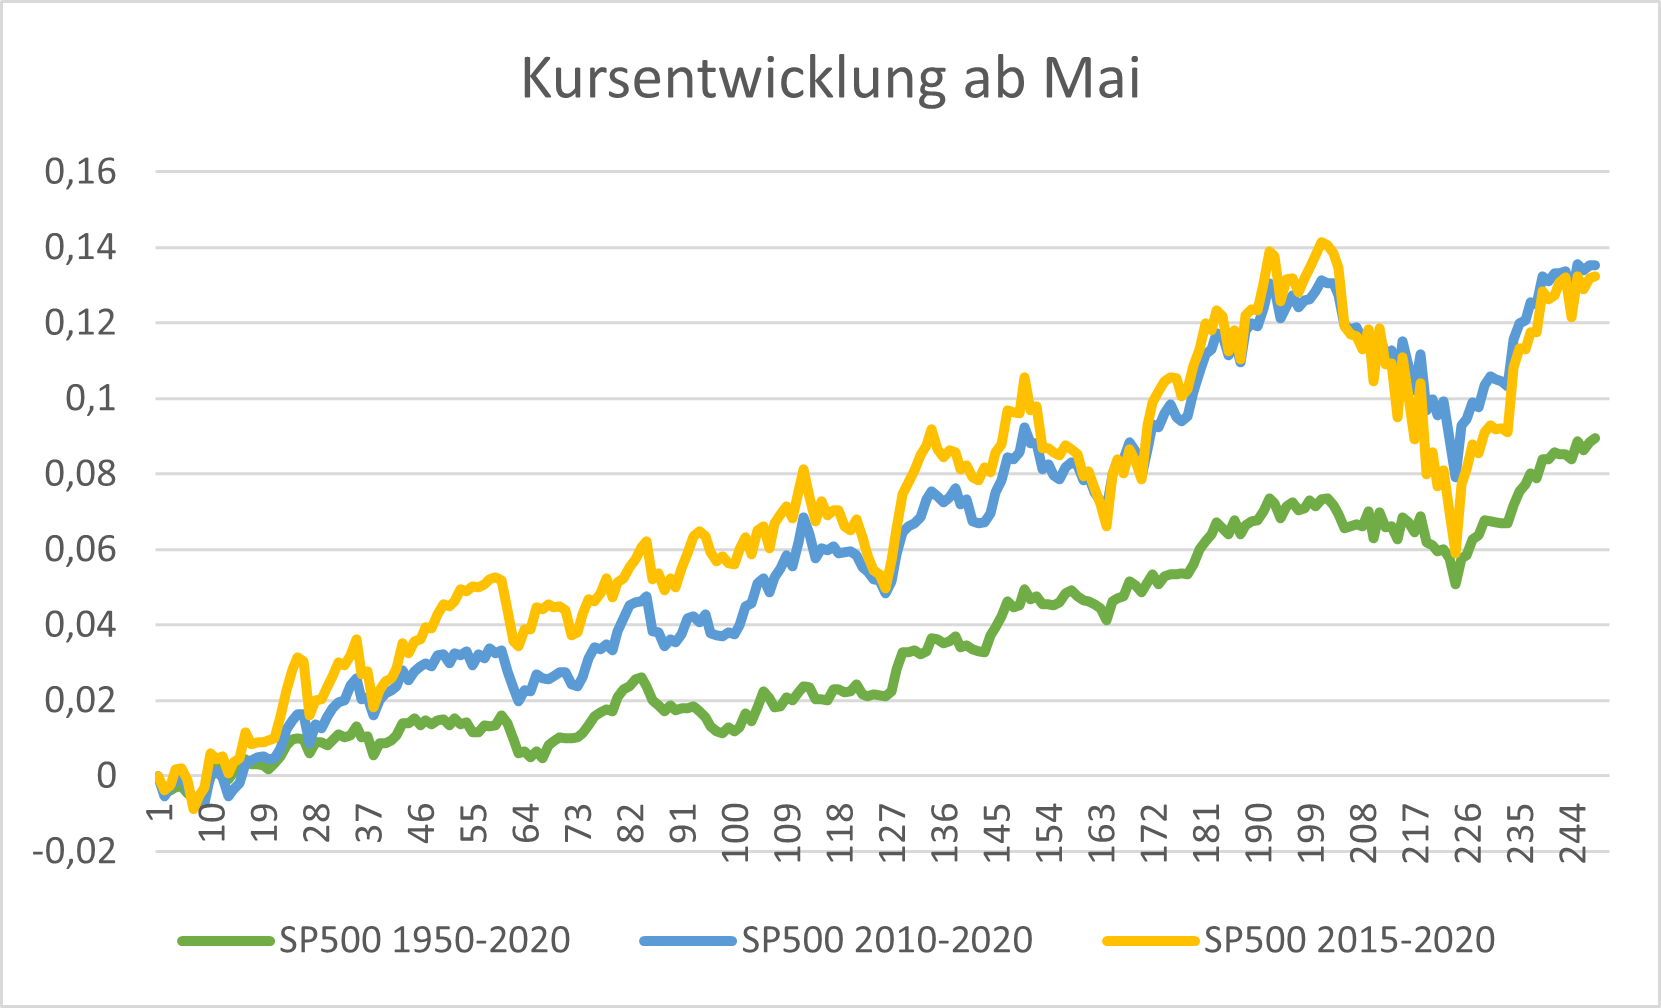
Average movement of the S&P 500 from May to May
Ready for Better Investment Decisions?
Start your free trial today - stock analysis with artificial intelligence.
Full Transparency | Full Access | Cancel anytime
For the S&P 500, however, this statement cannot be maintained as such. We see a significant increase at the beginning of the time series from May into July. The vacations apparently start later than thought. In the 70-year history, the price indeed doesn't budge from early August to the end of October. However, this pattern has not been confirmed in recent years and prices on the American side were able to increase throughout the entire summer. We see clear weakness rather in February and March - Corona.
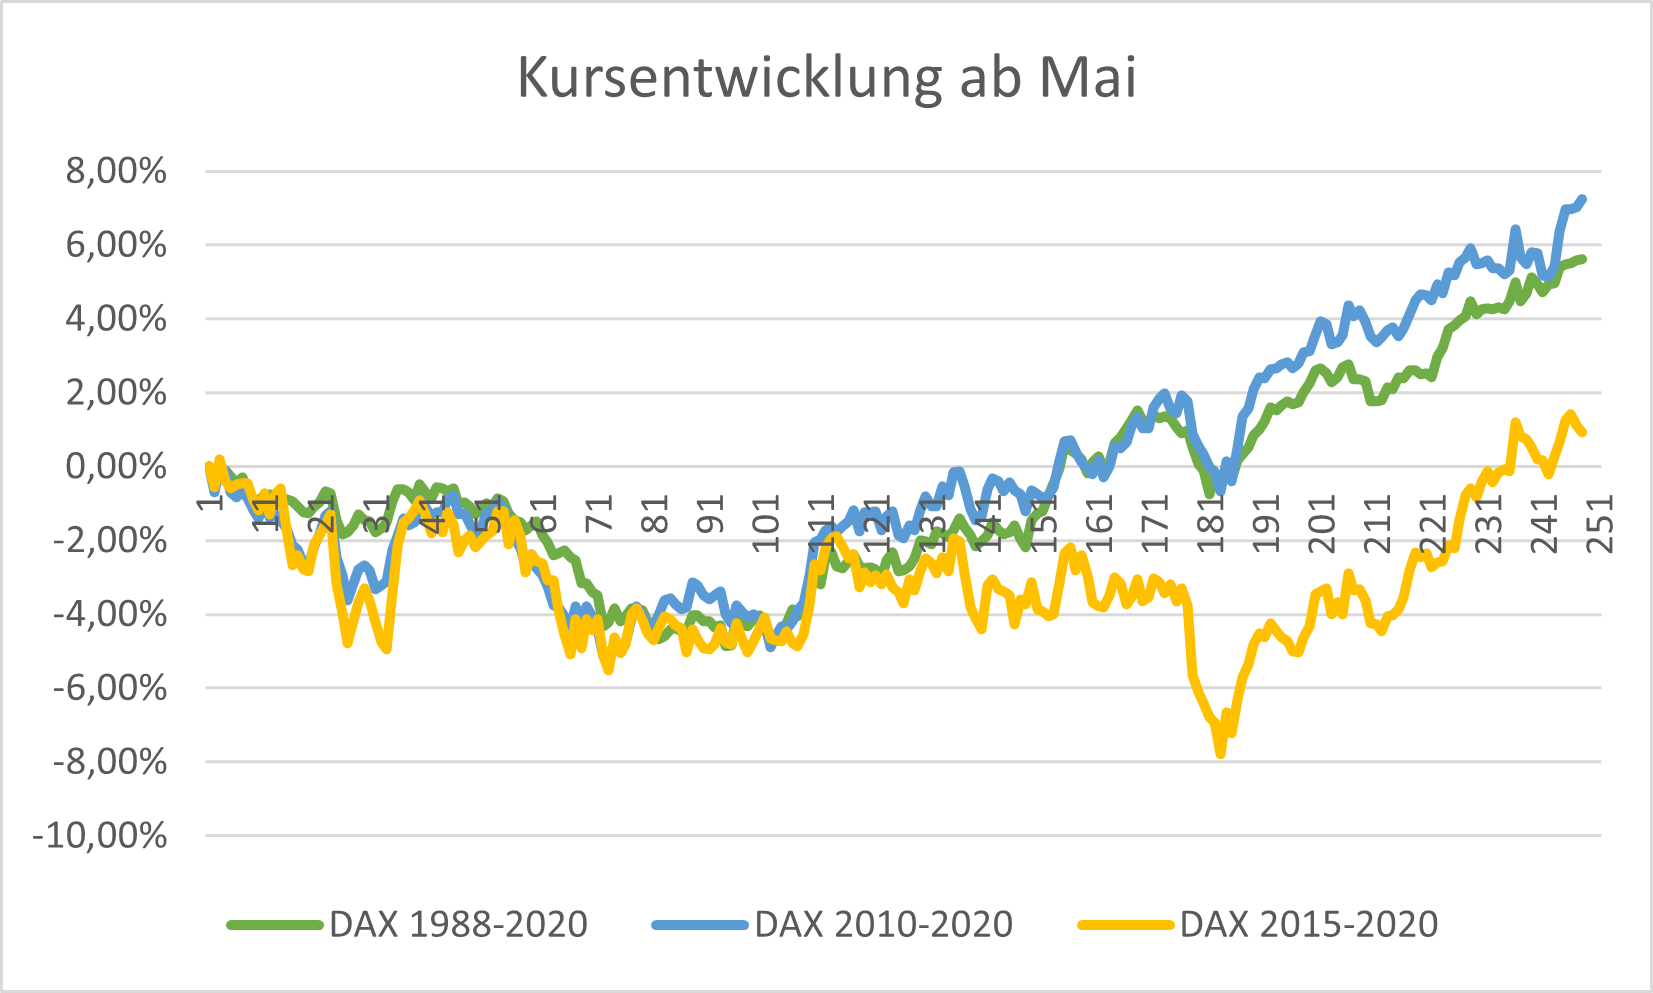
DAX from May to May without Corona year
Of course, the Corona year was a very unusual and drastic one. Therefore, we conducted the analysis once again without Corona. The DAX has behaved somewhat unusually in recent years, but with longer history the pattern is clearly confirmed. The DAX rises from November to April and falls May to September/October.
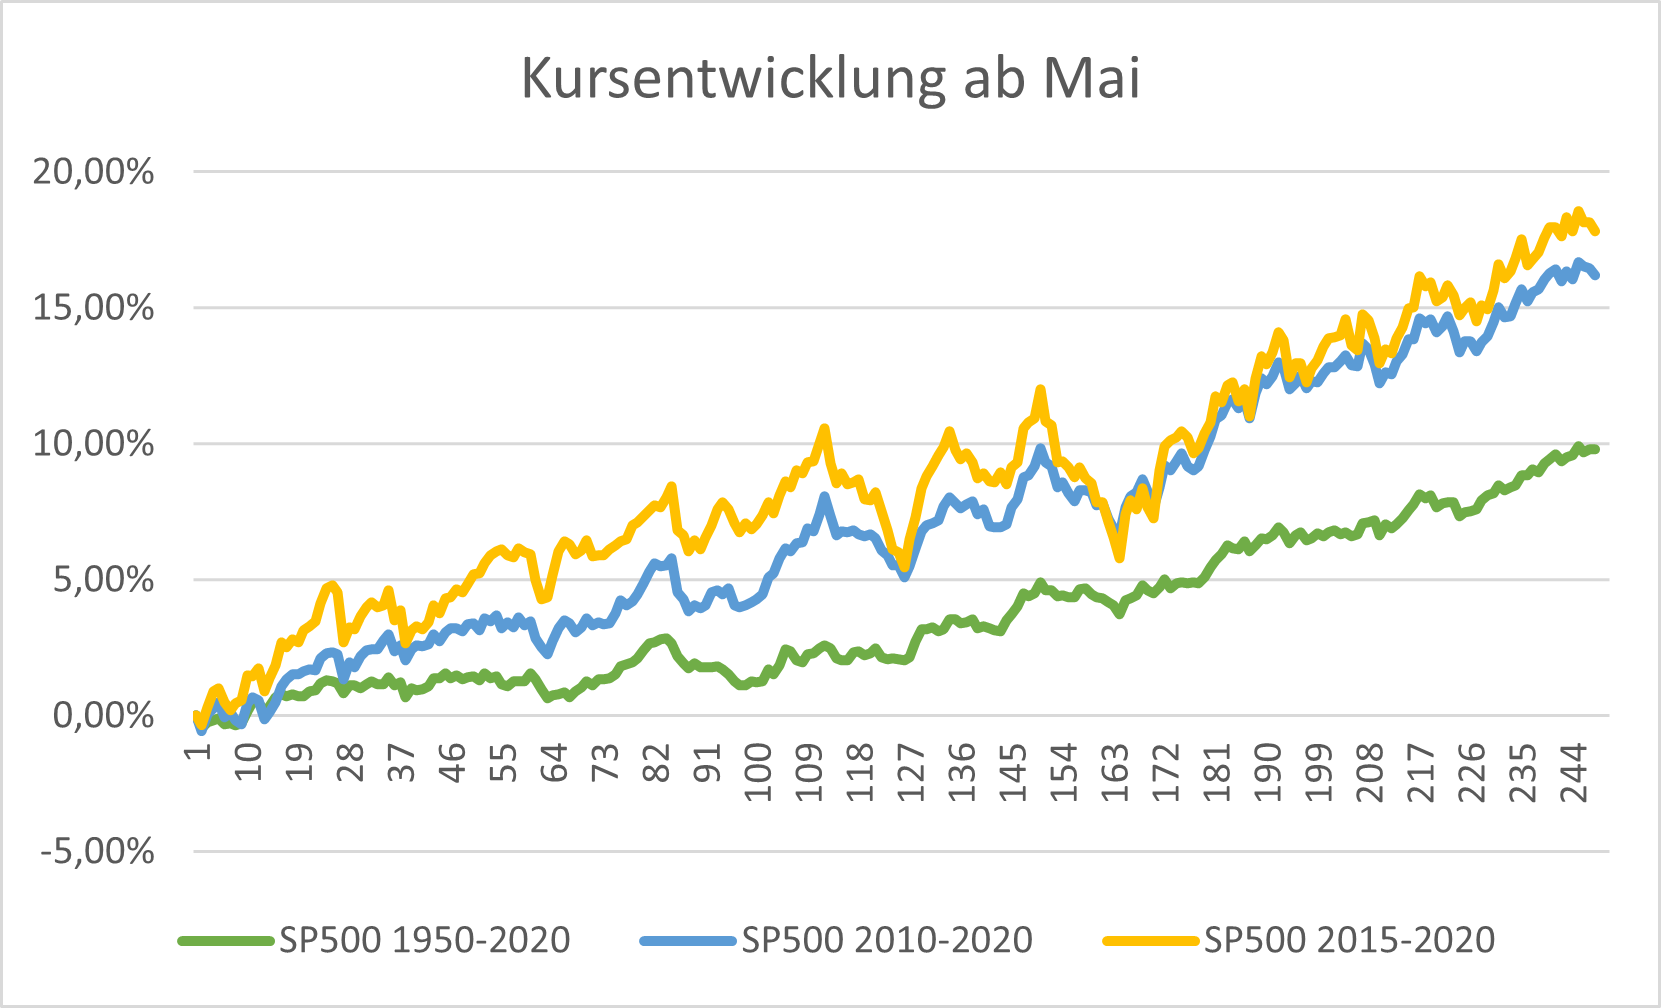
S&P 500 from May to May without Corona year
On the other hand, the S&P 500 does not confirm the pattern even without Corona. In the last quarter (approximately 100 to 160 trading days after May) we see higher volatility. The trade dispute of 2018 exerts significant influence. But at least in the more recent past, the American market rises relatively linearly regardless of any seasonality.