For our Stock of the Week, we suggest a stock each week where we see the best risk-reward ratio for the following five days. The strategy has been running since December 2020 and so far our selection has proven very strong. Last week we chose Aspen and the stock rose from Monday's opening at 150 USD to an interim high of 169.22 USD - a weekly gain of 12.81%. Unfortunately, shareholders took profits on Friday, so in the end only a gain of 8.97% was recorded. Nevertheless, the second strongest performance of a stock of the week so far. This increases the cumulative performance of the strategy to 78.9% in 10 months and 39 trades.
What were the criteria for choosing Aspen? First of all, only the top performers of our fundamental analysis are considered as possible candidates. As a rule, we choose from the Market-Fit segment. However, if the outlook for Value is promising, we also look at the top stocks in the Value ranking. Aspen Technology shows an absolute top rating of 90.2 on a scale from -100 to 100 in the Market-Fit segment.
In the second step, we perform a technical screening. A good technical analysis incorporates different time frames and patterns that confirm, expand, or even contradict each other. Let's first look at the big picture in weekly candles:
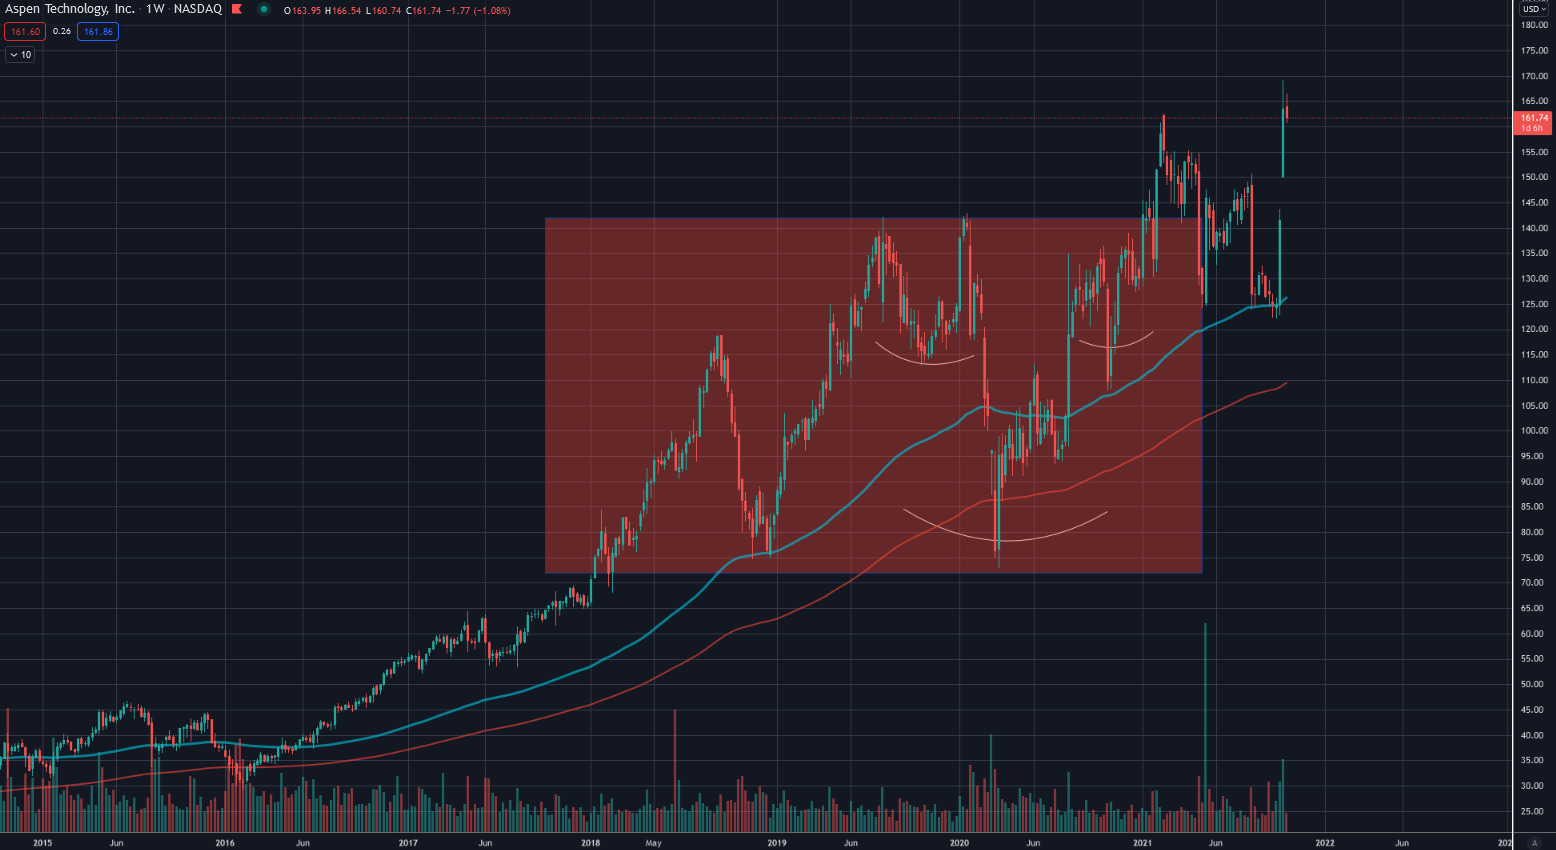
The situation: After a strong rally, Aspen has entered a consolidation mode since 2018 and is moving sideways with volatility (red box). The box is drawn generously but that's not so important. What's important is that the stock is coming out of a long sideways movement. Within this movement, a large and messy inverse head-and-shoulders formation (iSKS, smiling smiley in gray) has formed. This iSKS triggered at the beginning of the year, but couldn't really develop its momentum.
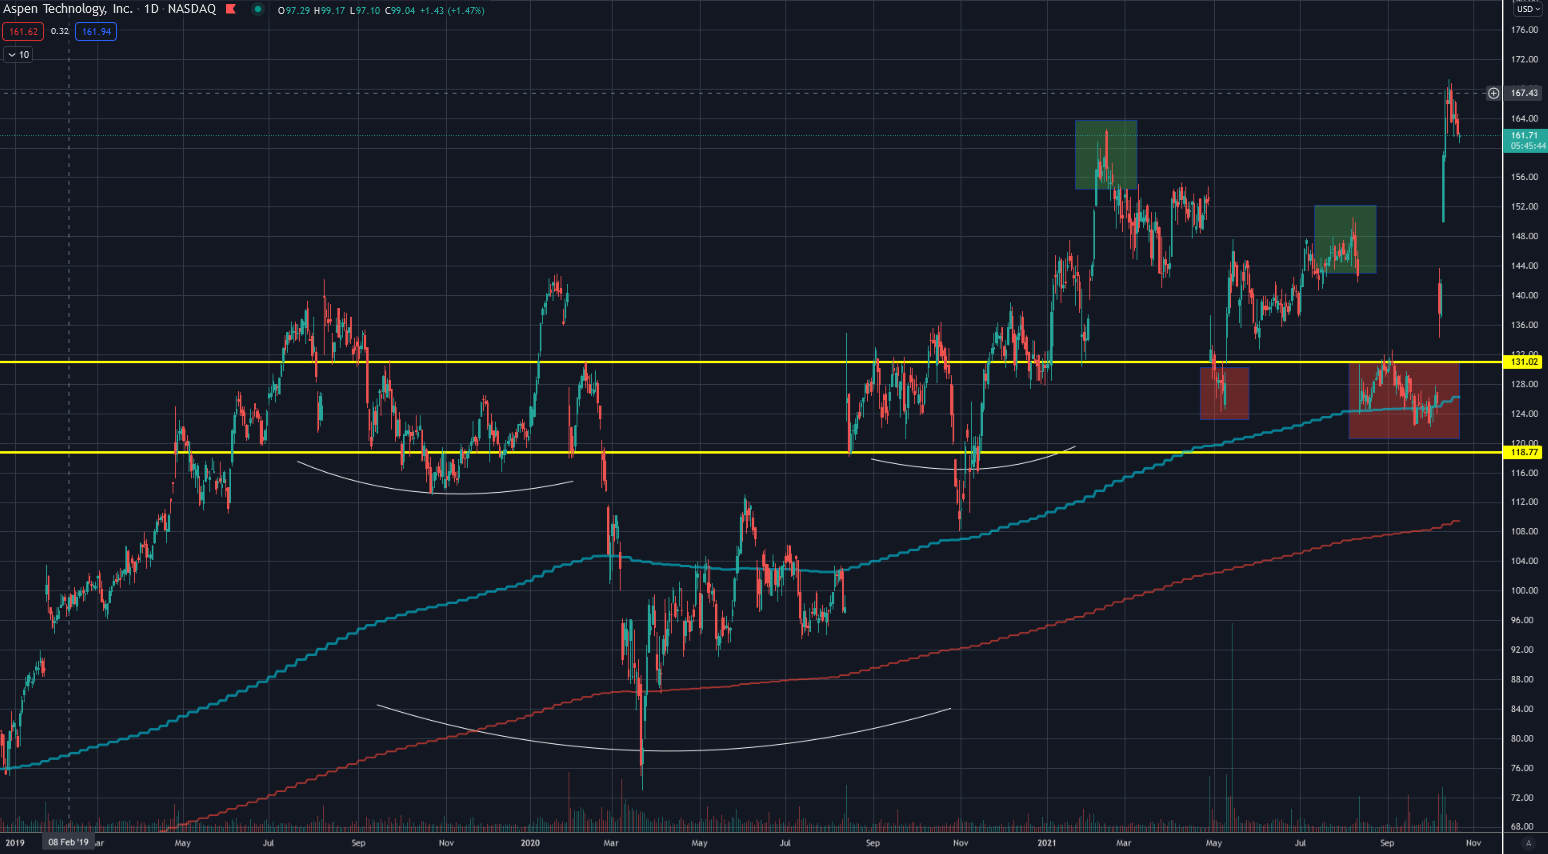
Instead, the price works its way between brief breakouts (green) and pullbacks into the support zone of the iSKS neckline (support yellow horizontal, pullbacks red). This behavior is an expression of the psychological state of market participants. They are uncertain whether last year's movement was a failed breakout or the beginning of the next major move and therefore react drastically to every new piece of information. Already at the end of June, Aspen was our stock of the week and rose by an acceptable 1.45% during that week.
Ready for Better Investment Decisions?
Start your free trial today - stock analysis with artificial intelligence.
Full Transparency | Full Access | Cancel anytime
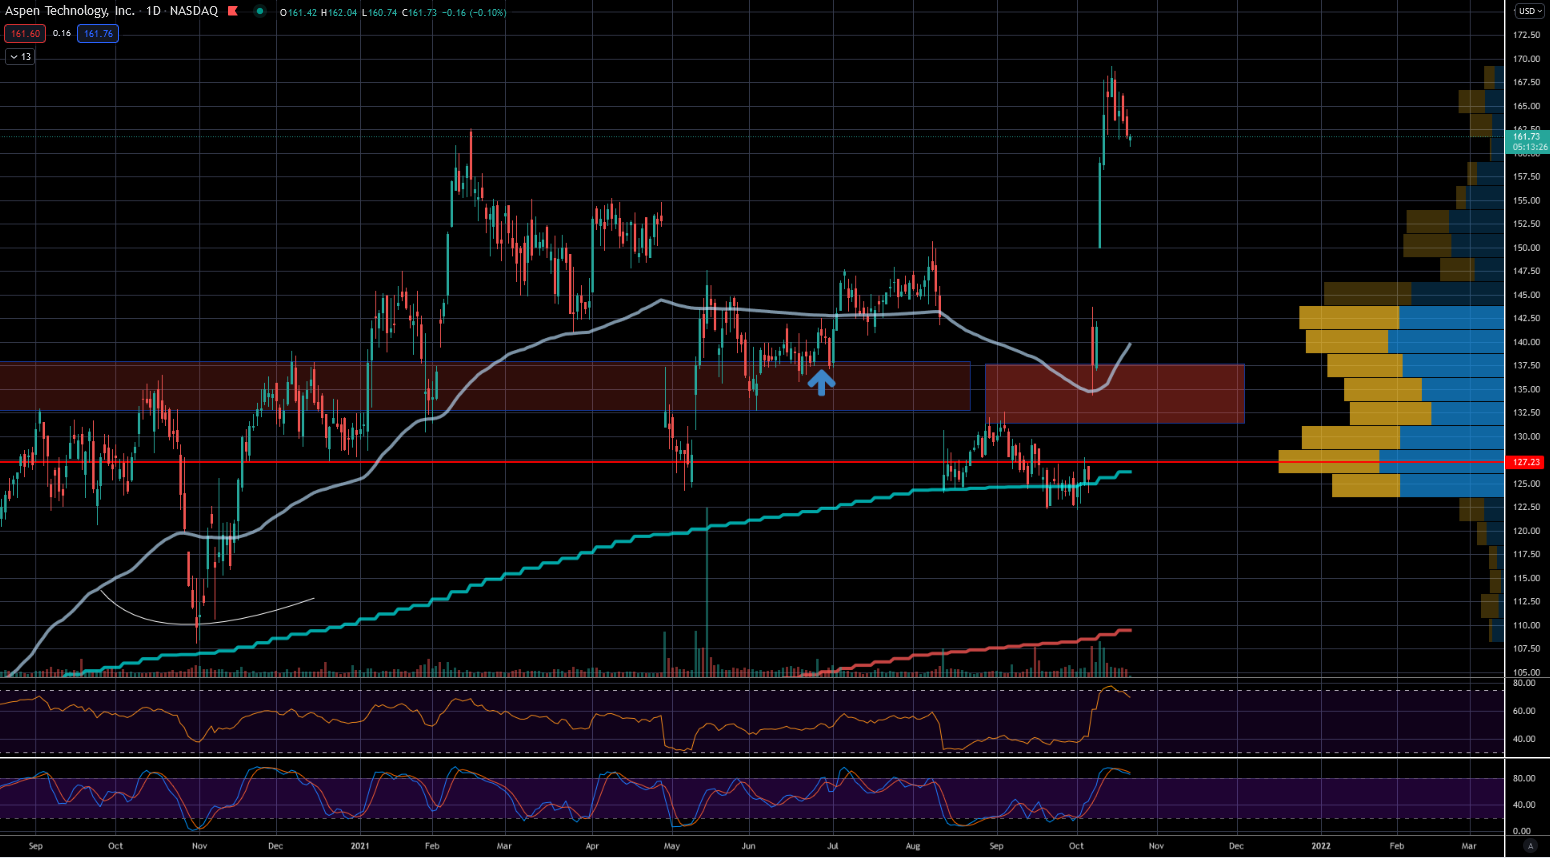
Our first recommendation came on June 28 (arrow), after Aspen established itself above the resistance zone of the neckline and showed good chances for a decision in favor of a successful retest and an acceleration to the north. However, in the context of quarterly results at the beginning of August, shareholders' expectations were not met. The general uncertainty leads to a knee-jerk reaction that sent the price back to the year's lows. Here, however, the fast moving average (turquoise) and the Volume Point of Control (VPOC, red horizontal) had now joined the support from the iSKS.
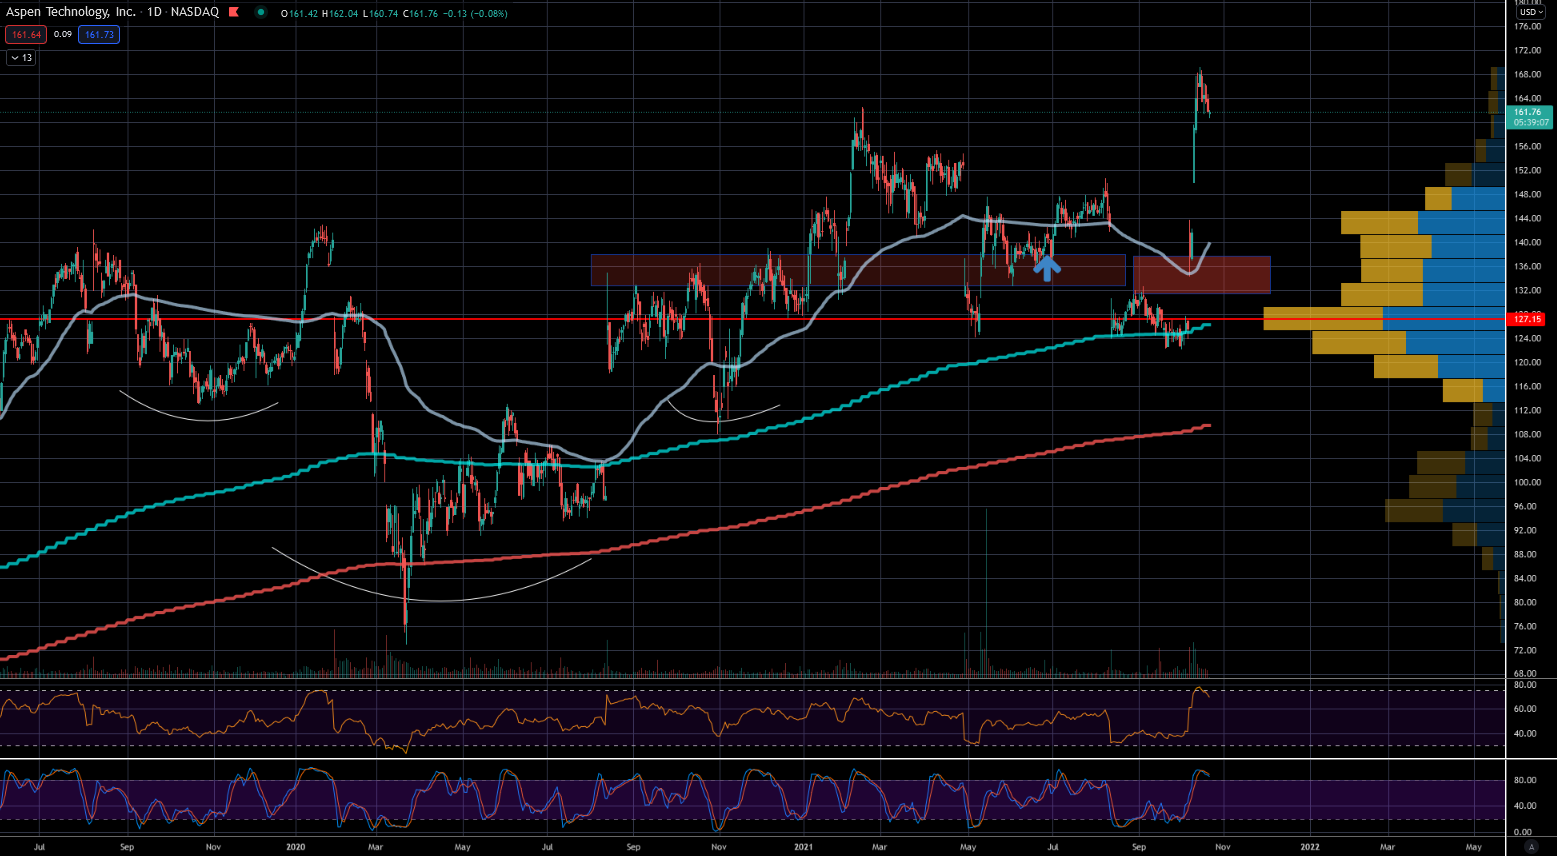
During our screening on the weekend of October 9/10, we saw the above picture: The price did not break through the support levels downward in September and had established itself with a small double bottom. On Thursday, the price then jumped above the red resistance zone with a gap-up at market opening. The reason was a merger of Emerson's software division with Aspen. The extreme gap-up was an indicator of how much fear traders had of missing out on something. Thursday's close and the strong Friday, which bounced exactly off the red zone, ultimately confirmed this breakout once again and made a dynamic continuation likely.
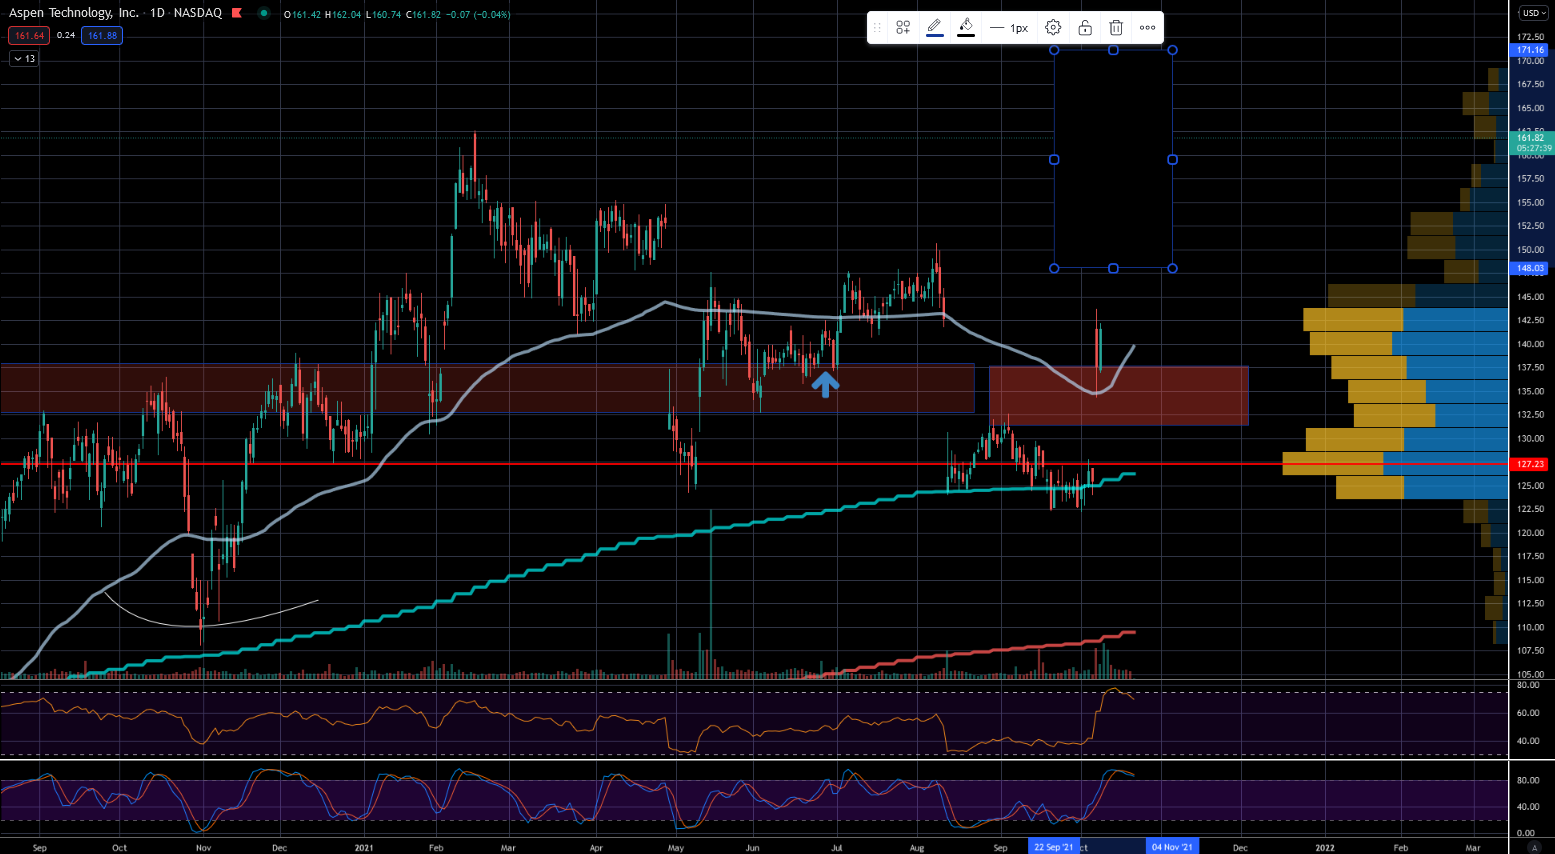
This expected momentum ultimately materialized like a textbook example. Another gap-up at the start of the week on Monday resulted in an opening above all resistance levels. The panic of missing the movement pushed the stock to new all-time highs during the week and gave us a wonderful performance of almost 9% for the stock of the week.
By the way, our choice for the current week has fallen on Apple. Here too, the stock was sitting on support after the breakout from the one-year consolidation. Currently (as of October 21, 4:51 PM), Apple is up a good 4%. This brings our target of 100% performance for the year within reach. We now have seven more weeks for that.