For almost three months now, we have been writing about the phase of direction-finding that has dominated the stock markets. This phase is now in all likelihood coming to an end, and the signs are good that after a temporary period of weakness, it will resolve to the upside. Nevertheless, there is a very real crash risk if the setup fails.
The Scenario: Rally (green)
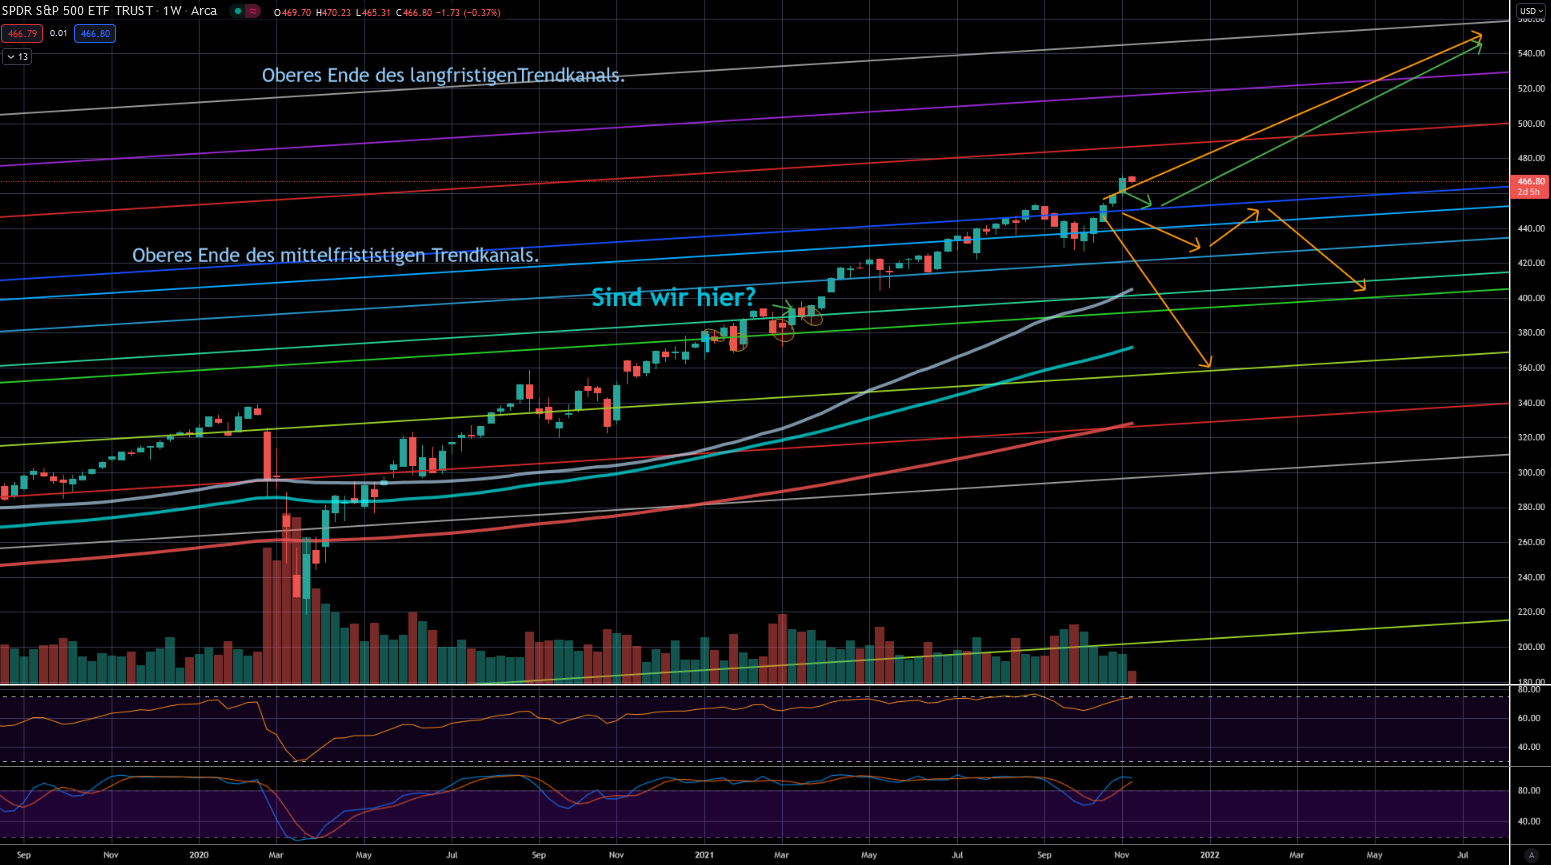
Nothing has changed in the bullish scenario since the last article. I expect a brief pullback of about 5%, which will conclusively confirm the formation of recent months, followed by a rally of 20 to 25% into next summer. Why is this scenario preferred? The price behavior of recent weeks has been strong. The pessimism at the lows of September/October was extreme, and even now the sentiment of retail investors is far from euphoric. The strongest sign, however, was the cluster of buy signals in our market timing around the breakout and into the FOMC euphoria.
At the same time, the market showed strength in every upward movement, while downward movements found their end surprisingly quickly and early. Currently, the market is somewhat overheated; a pullback to the highs would reduce this overheating and trigger a wonderful buying opportunity.
The Scenario: Bear
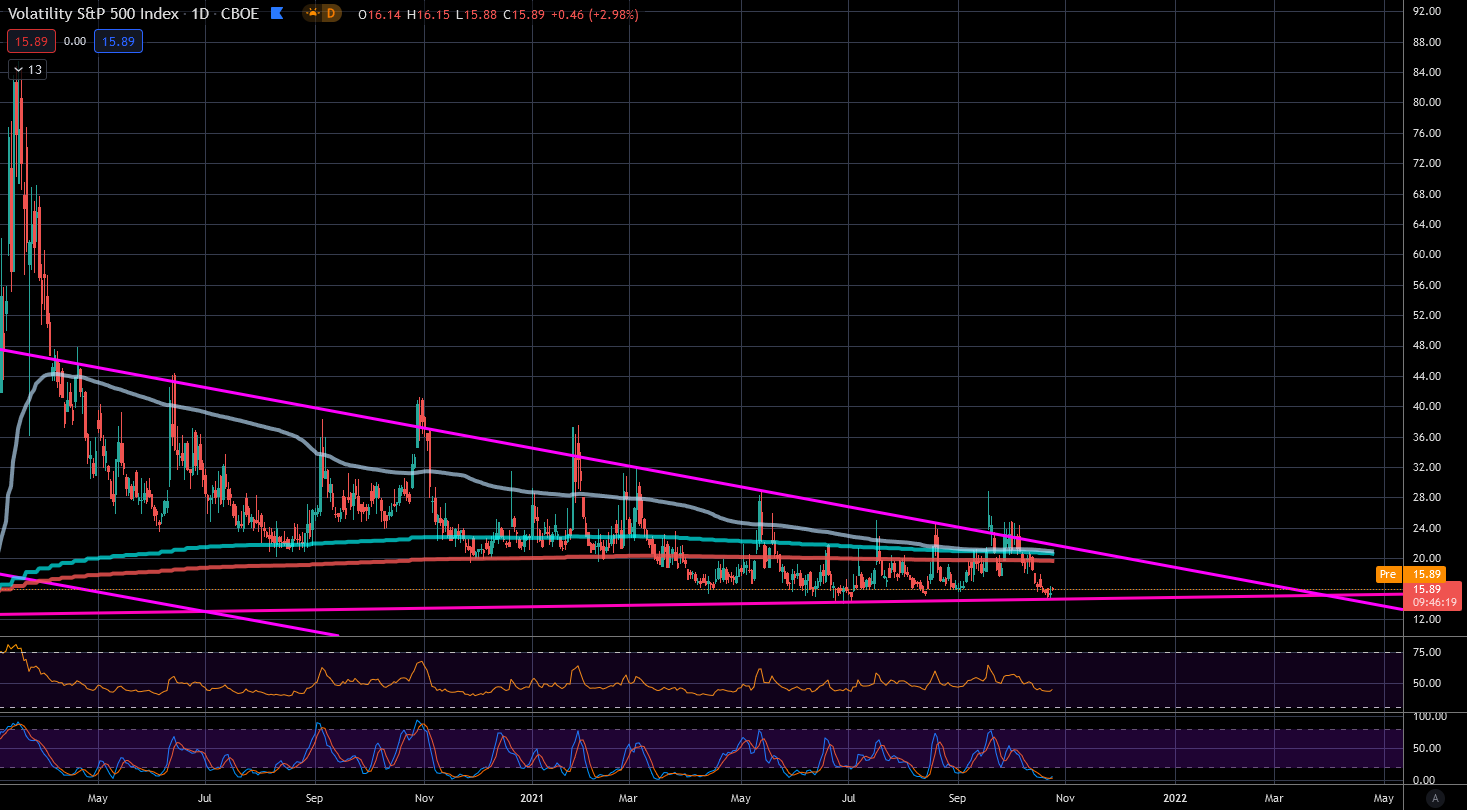
An important building block in recent weeks has been the VIX chart, which shows a very striking formation. Here again is the chart from the last article.
The expectation of a further rising market goes hand in hand with a break of the uptrend in the VIX that has existed since the end of 2018. In the bullish scenario, the VIX breaks downward after the successful retest of the S&P 500. On the other hand, should the VIX break through the DOWNTREND and the moving averages to the upside, an opposite scenario becomes active.
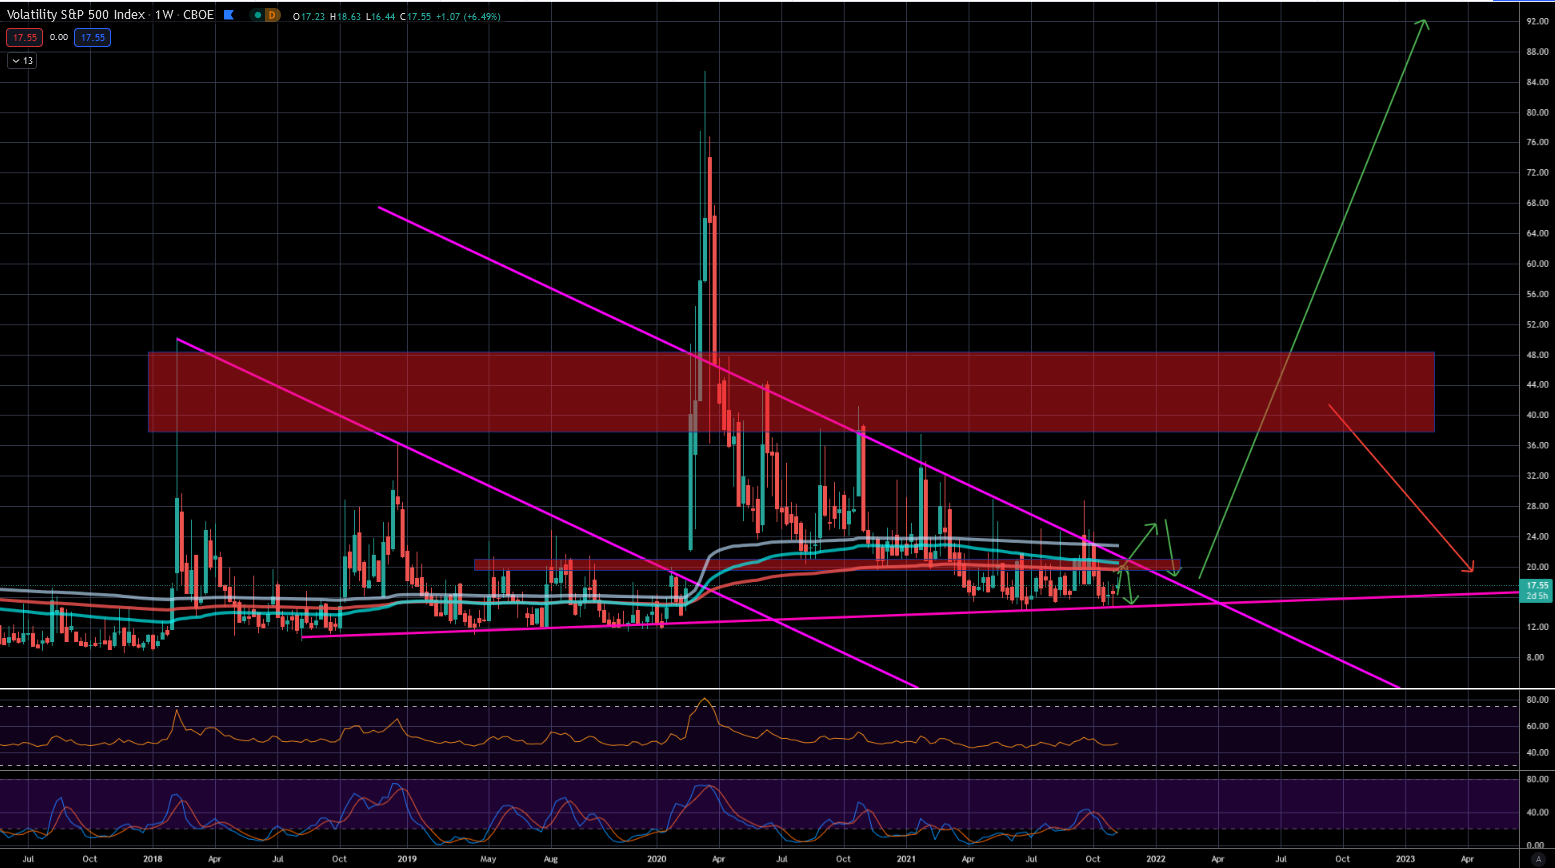
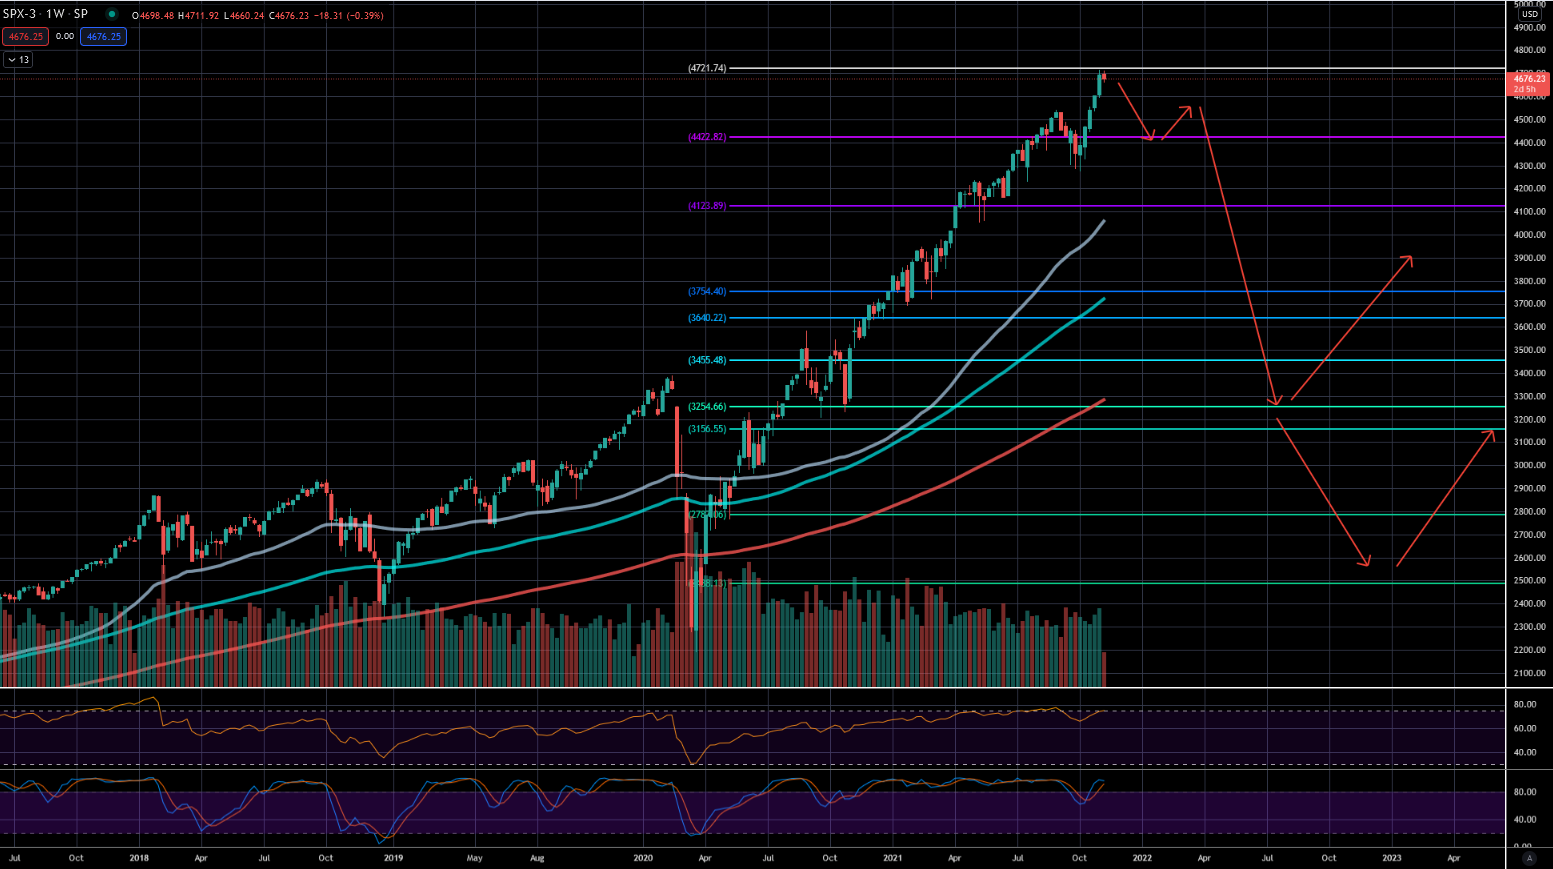
In this case, a repetition of the crash scenarios of 2018 and 2020 would be looming. There is potential for this to become even more extreme than the Corona crash. Such a development would usher in a downside potential of almost 50%. In the S&P 500, the scenario corresponds roughly to the following course:
Ready for Better Investment Decisions?
Start your free trial today - stock analysis with artificial intelligence.
Full Transparency | Full Access | Cancel anytime
This scenario appears significantly less likely than the continuation of the rally. Not only for the reasons for the bullish behavior from above, but also because at ~20 points in the VIX, five resistance zones from three moving averages, a top-bottom series, and the trend line coincide. Nevertheless, it must be watched very carefully. Should the VIX break out to the upside, one would be well advised to reduce risk. This can be done by building up cash, building up hedges, or consistent protection through stop loss levels.
Rally for Gold
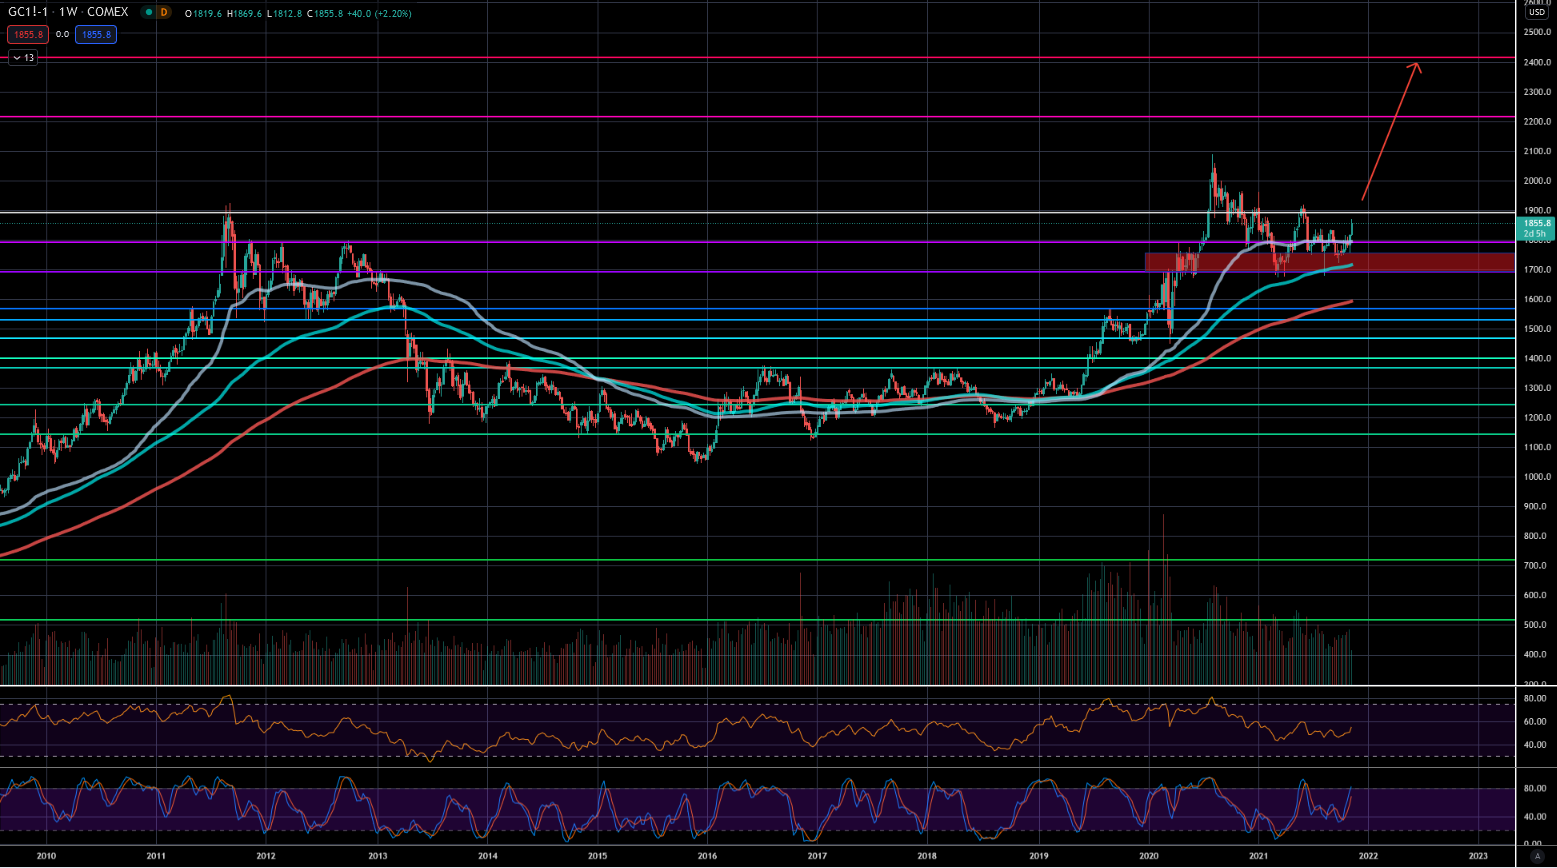
We are currently seeing a wonderful setup in gold. The consolidation after the breakout from the end of 2020 is establishing itself above the breakout zone and is slowly stretching northward. Attempts to penetrate the resistance zone from 1700 to 1750 were quickly and sustainably bought up. A break of the 1900 mark should release new momentum here toward 2400. With a comfortably wide stop loss just below 1700, you still have a risk-reward ratio of almost 3:1.
Silver like Gold only better
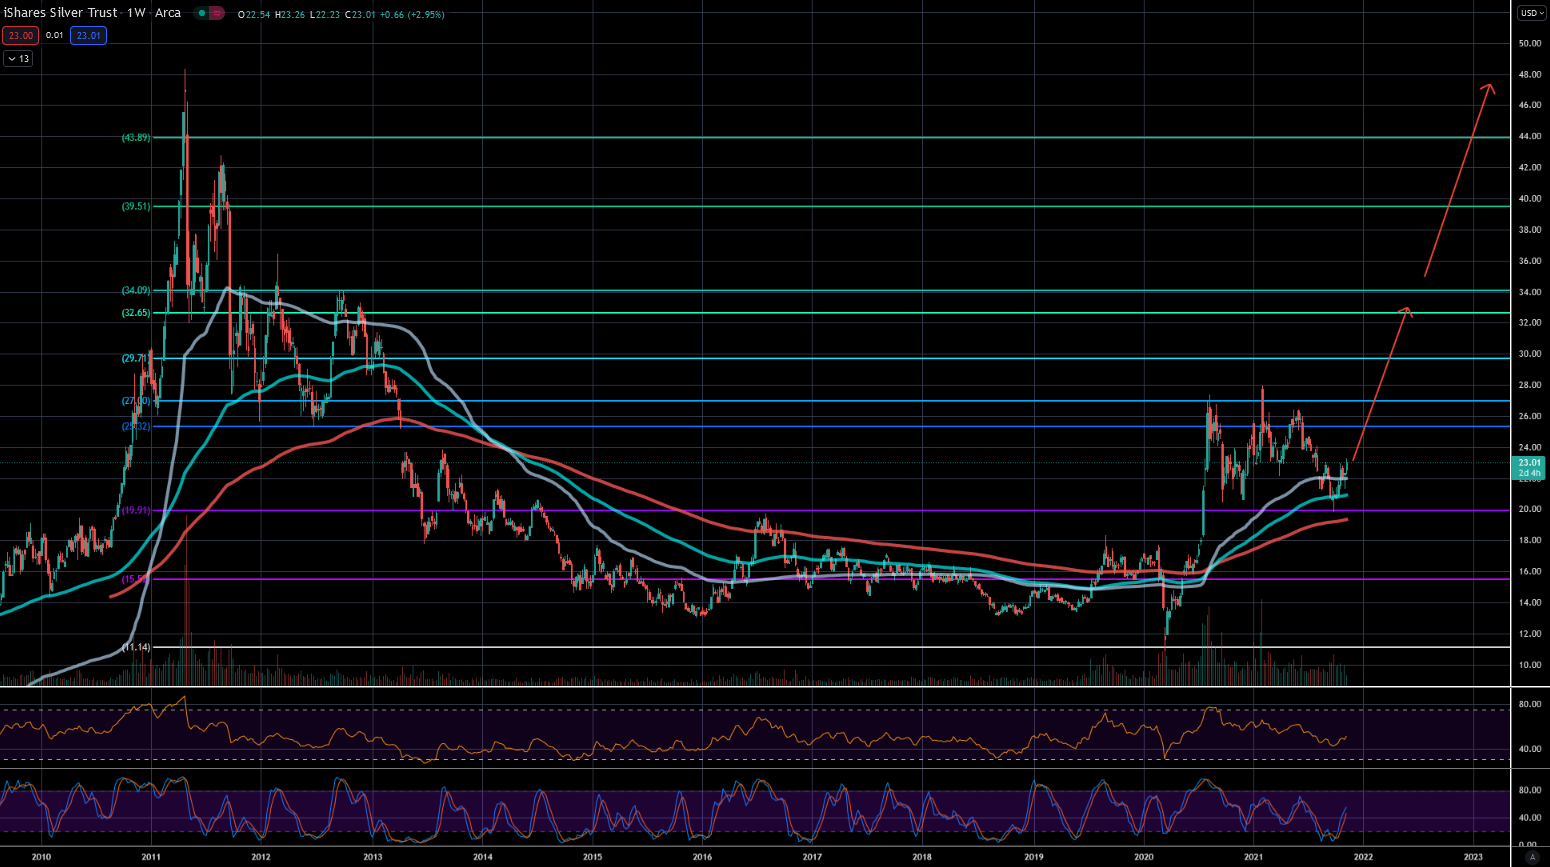
Silver shows a similar picture to gold in many respects. After the major top in 2011, a decade without gains followed. During the Corona crash, silver then broke out dynamically and has recently consolidated the movement at a high level. Here too, the price is ready for the next surge. Unlike gold, however, silver is significantly more volatile and earlier in the movement, so potentials of almost 50% and 100% open up with price targets at ~32 and ~48 points. Protection below the annual low of 20 points allows an extremely favorable ratio of opportunity and risk.
I wish you much success!