Dear Readers,
first a brief review and classification. Just over two months ago, we declared the last rally from the first half of the year as ended and expected a phase of direction finding. Since then, the market has not really moved forward as expected, but rather probes slightly higher in some cases, slightly lower in others. Exactly one month ago, the question arose whether the weakness would be the introduction to a larger downward movement.
Ultimately, the market looked briefly lower at the end of September, but then recovered surprisingly quickly. Short-term market timing showed the increased upward opportunities with several buy signals on September 20th and 21st and from September 28th to October 4th.
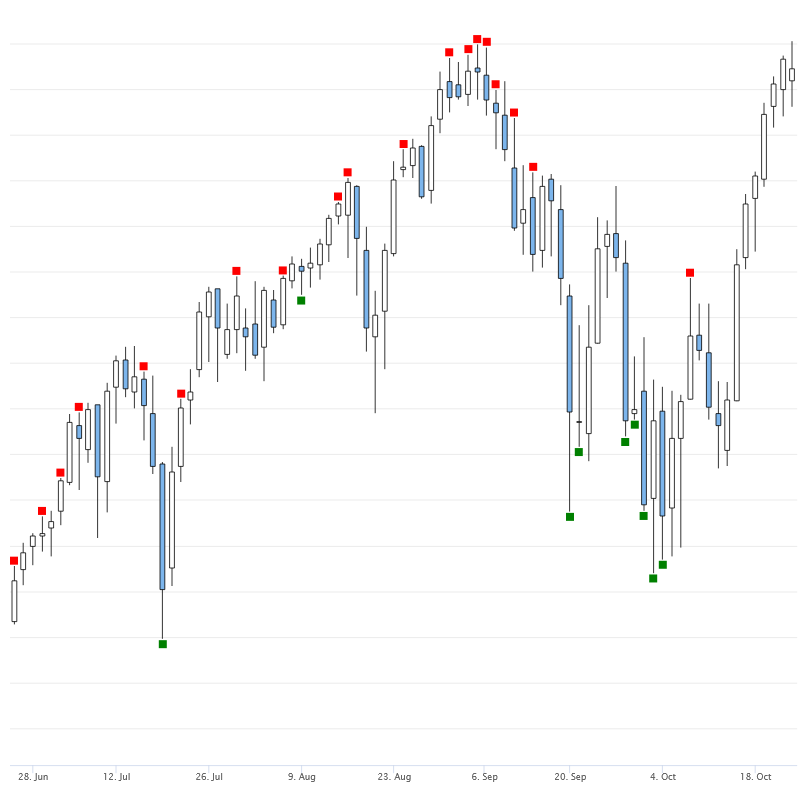
The signals ultimately led to a nice inverse head and shoulders pattern (iSKS), which triggered almost two weeks ago and brought us back to the old highs in the S&P 500. The sentiment among retail investors was also extremely pessimistic, which made a long downward movement seem unlikely. Now the expected movement of these short-term signals and formations has been exhausted and the markets are at an important crossroads. In our article from August 15th, we identified the long-term trend in the volatility index VIX at currently ~15 points as a critical mark. Here again is the chart from that time:
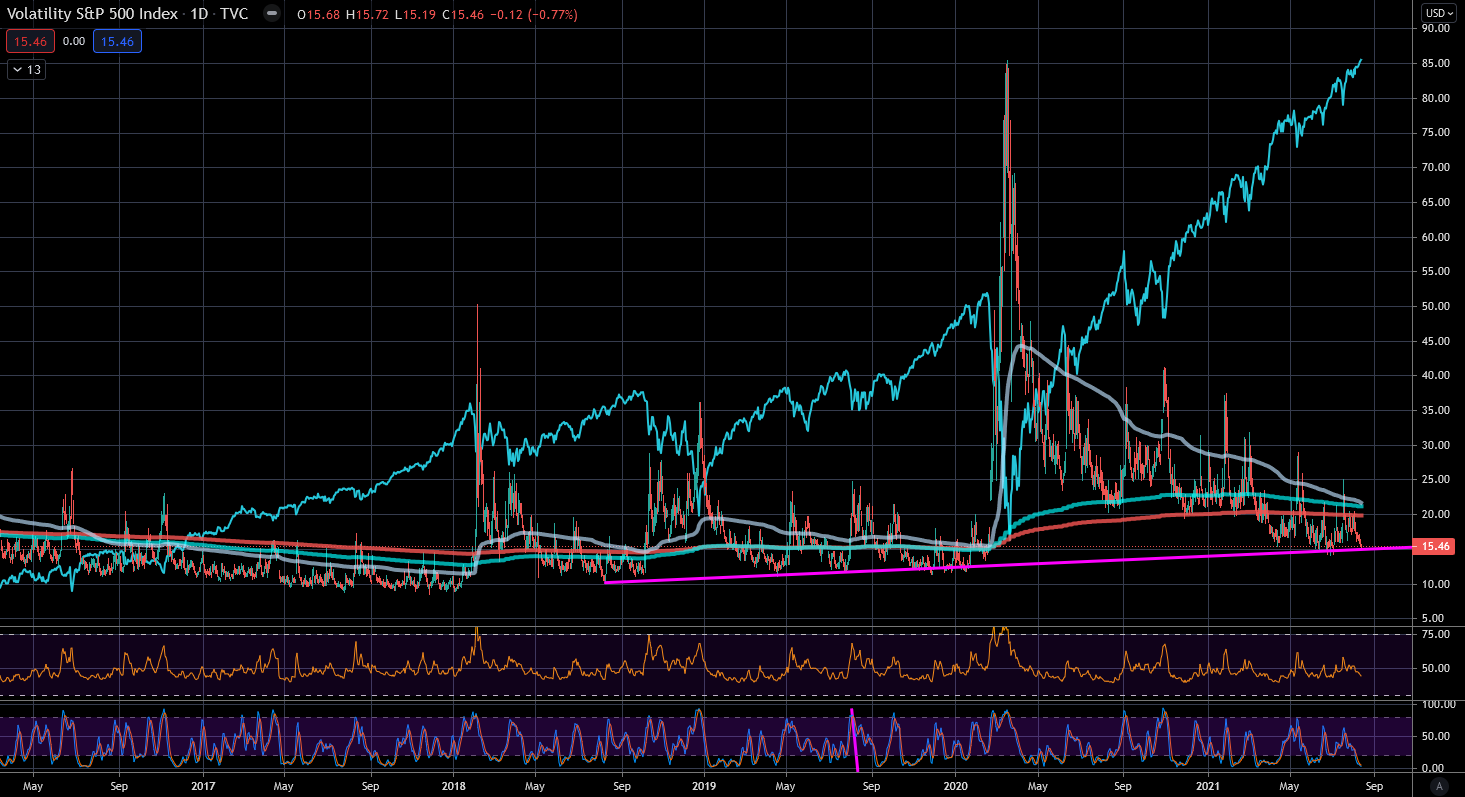
At that time, the index sat just above the trend line. In the following days, uncertainty came into the market and the VIX rose in several swings while the stock markets experienced their weak phase in September. After the stabilization discussed above, the VIX also came back to bounce precisely from the support on Wednesday and Thursday of last week.
Ready for Better Investment Decisions?
Start your free trial today - stock analysis with artificial intelligence.
Full Transparency | Full Access | Cancel anytime
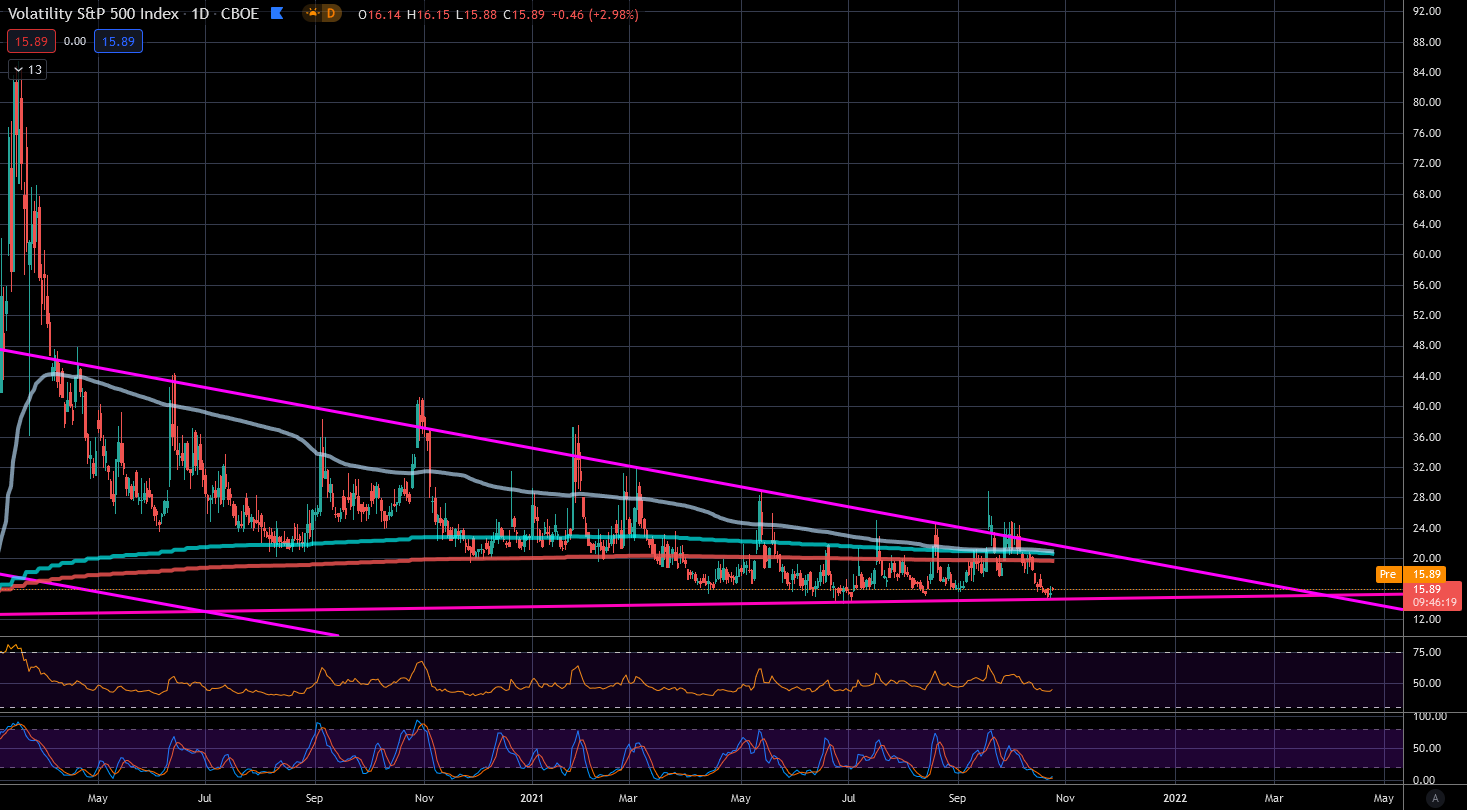
In parallel, the S&P 500 ran out of steam and the measured move of the iSKS was reached. If the stock market now rises further and the VIX can break through the 15 points downward, that would be a clear signal of strength. After that, we would look for a good entry point into the next long-term push after a retest of the breakouts and declare the direction-finding phase as ended if the retests are successful. Here again is our long-term chart of the S&P 500:
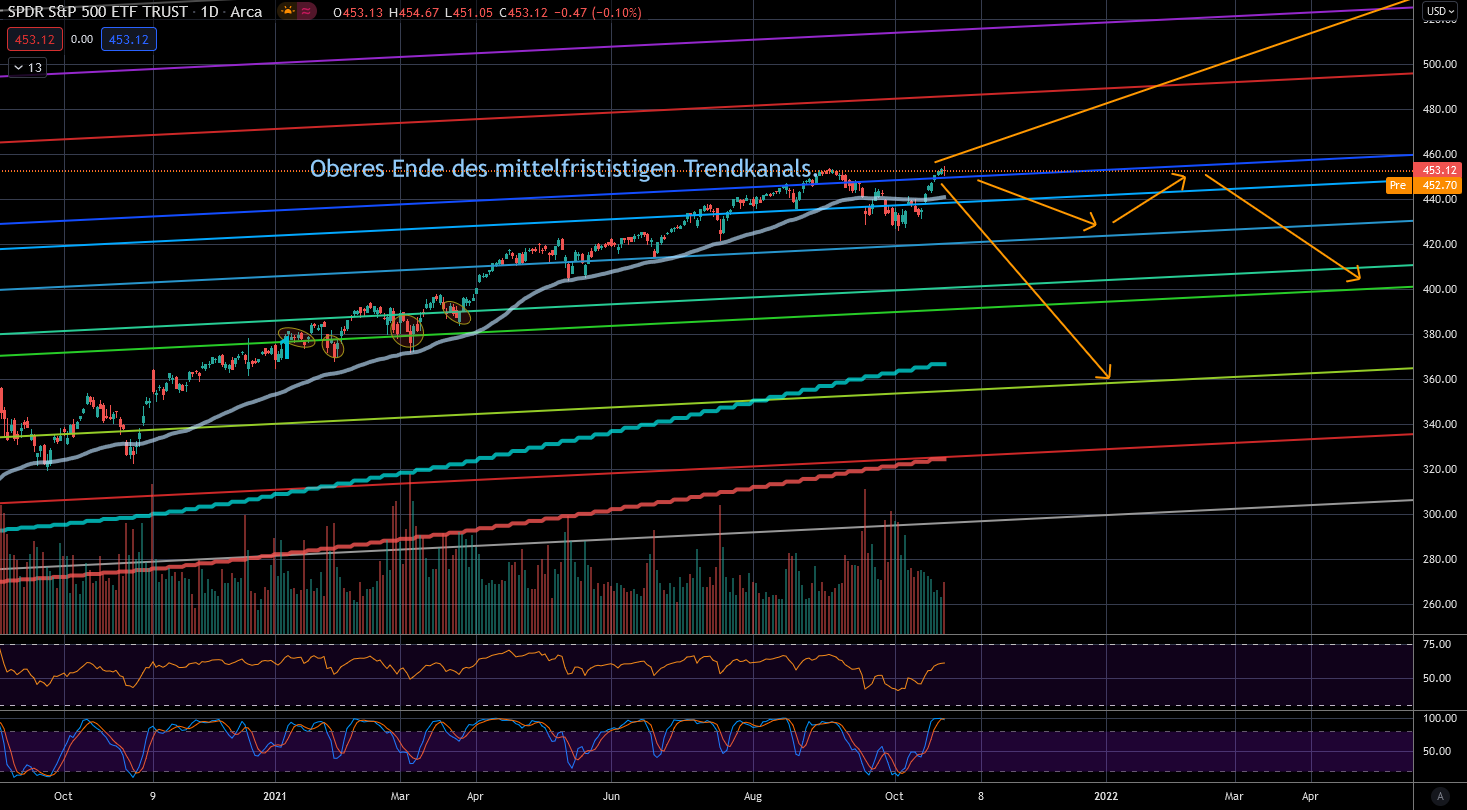
However, I consider it somewhat more likely that the market will take another lap at this point and not directly find the momentum for a sustainable breakout.
I wish you much success in advance!