Anyone who holds Plug Power knows what a volatile stock it is. From the end of 2018 to the beginning of 2021, the stock rose by around 7500%, only to collapse by 75% in the past month. For this reason, we will use a logarithmic representation in this chart analysis. Without it, the extreme exponential fluctuations would not provide a clear picture. Let's first look at the long-term chart:
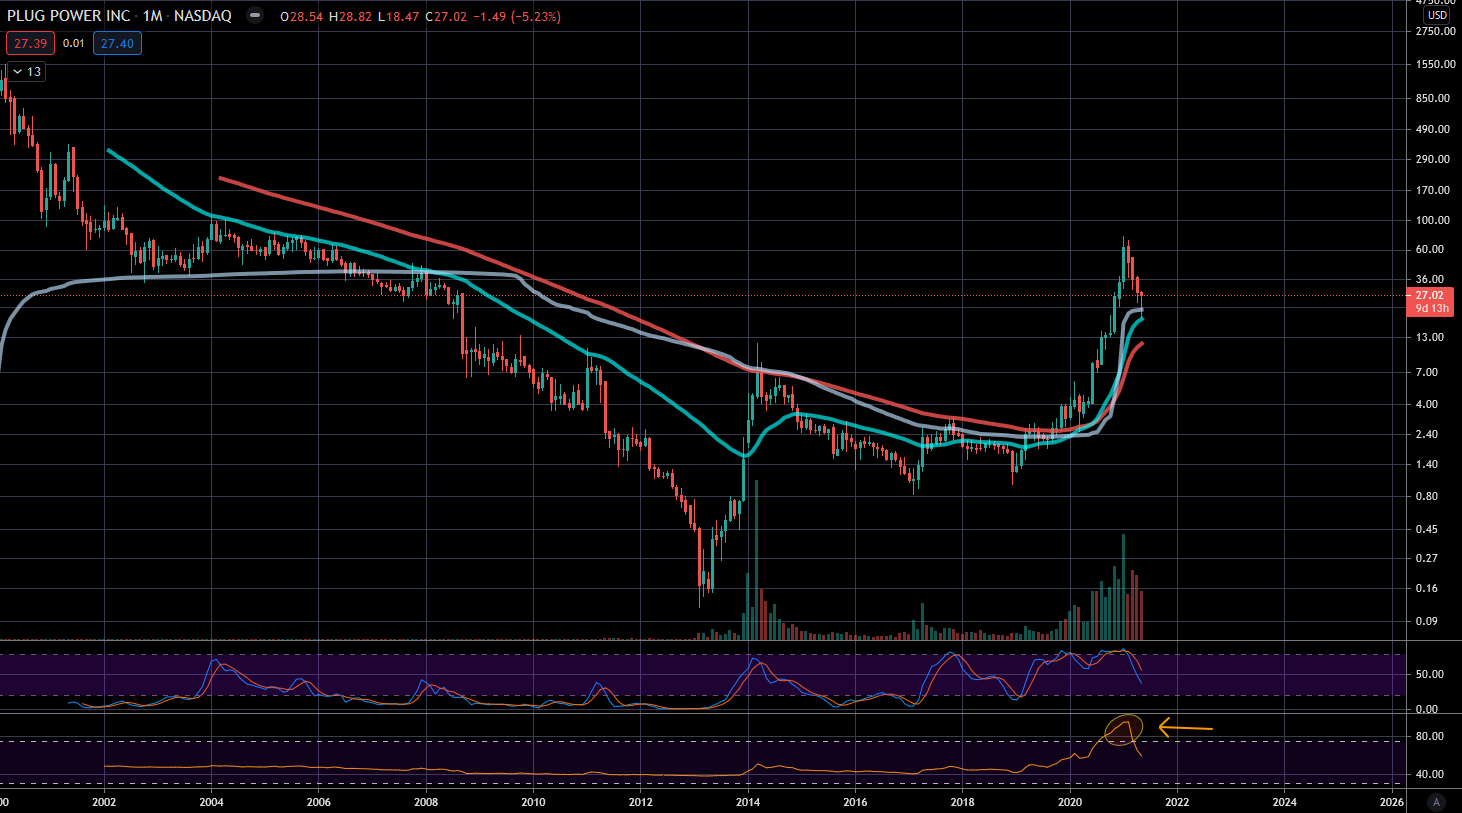
Here we can see that the past two years were actually completely normal for Plug Power. After the IPO in 1999, the price fell from a peak of just under $1600 to as low as 11 cents in winter 2013. Although the price has increased 625-fold since then, even at $75 at the beginning of the year we were not even close to the all-time highs. What is remarkable about this history is the similarity of the situation from the intermediate high in 2014 and the high at the beginning of the year. An extreme rally where volume increased sharply towards the end of the rally, only to end with a particularly large spike. It is also striking how extremely hot the RSI was running in the recent rally, even on monthly candles.
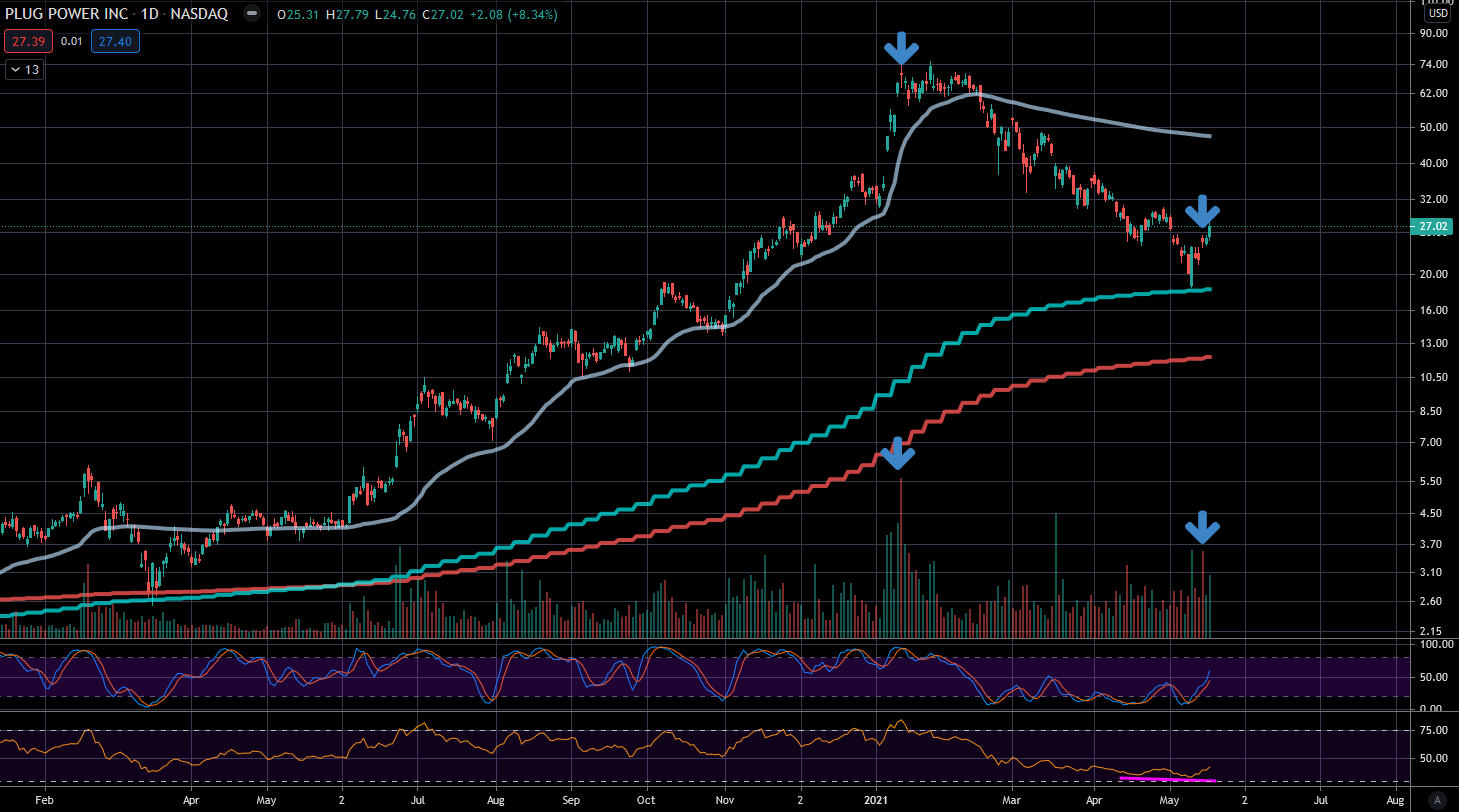
Looking at the daily chart, we can clearly see the volume spike precisely at the high. Two weeks ago, the price jumped upwards from our fast moving average (green) on decent volume. A good start. However, the further progression could not present itself as strongly. Instead of a dynamic break under volume, there was a brief lull and a high-volume indecision doji 3 days later. So the momentum was quickly blocked here. Even in the RSI, we could not detect any positive divergence into the low.
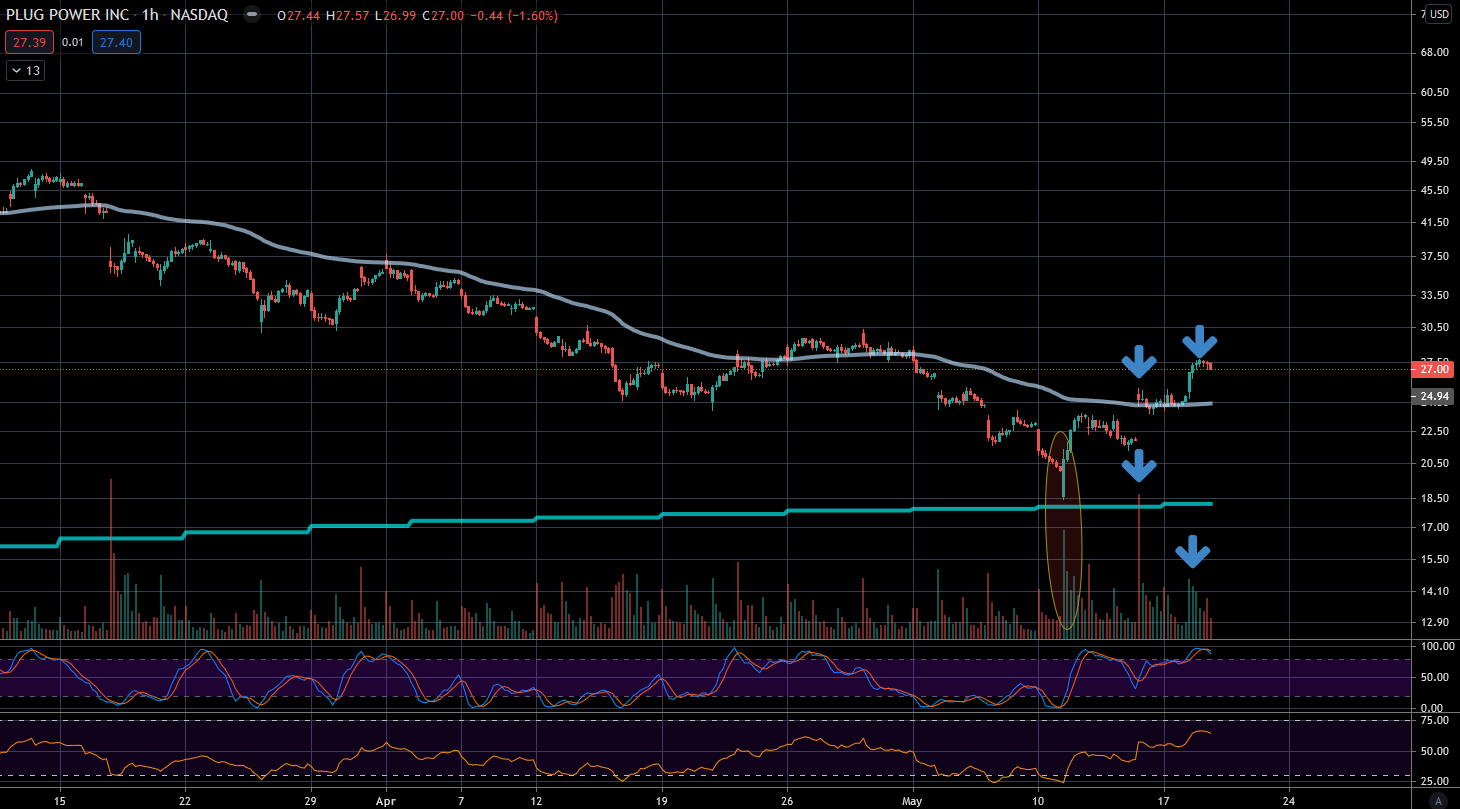
In the hourly chart, the action can be seen even more clearly. A promising dynamic chart quickly subsides. The massive volume spike that stops the momentum from the gap-up and the price then drifts sideways and downwards without direction. Even in the small follow-up rally, the volume is again in the high sideways phase instead of in the uptrend. None of this is a sign of sustainable buying interest.
Ready for Better Investment Decisions?
Start your free trial today - stock analysis with artificial intelligence.
Full Transparency | Full Access | Cancel anytime
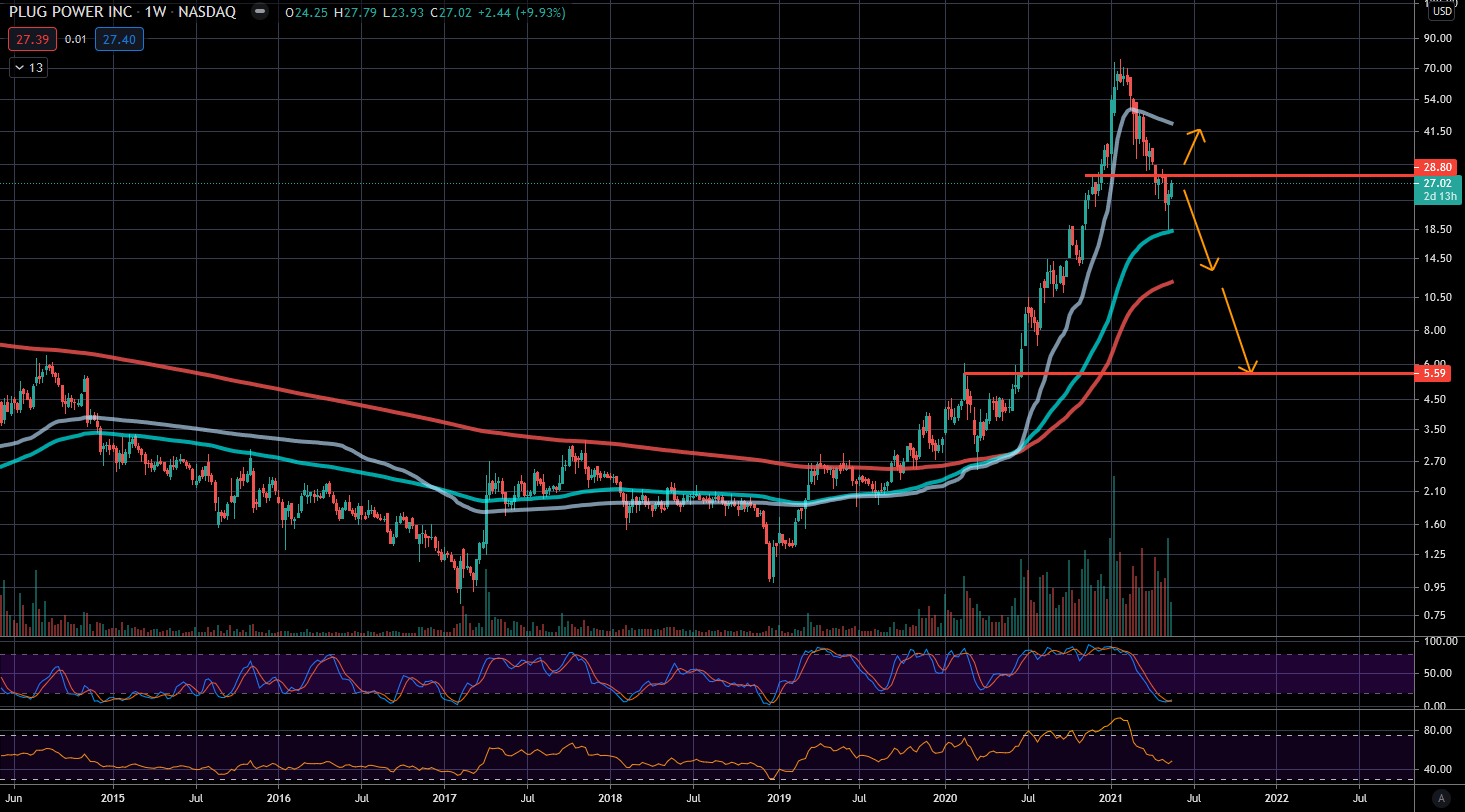
So what does all this mean? The reversal started strong but could not continue to convince. After a small pullback, the movement could now quite possibly lead to $40 - $50. As long as we don't see a dynamic breakout with some volume candles above the $28 - $30 range, a long-term continuation of the rally is highly unlikely. The similarity with summer 2014 suggests rather a multi-year dry spell. A further pullback to $12 and $6 would be a normal movement for Plug Power from a historical perspective.
From the intermediate high in March 2014 to the low 3 years later, Plug Power fell by 93%. With a pullback of 93% from the high in February this year, Plug Power would be at $6.
Lars Wißler does not own any of the mentioned stocks. PWP Leeway does not own any of the mentioned stocks.