Hello after a wild week. Right away: I have been extremely poor in my assessment and commentary, and that pains me. A quick review. For a good month now, we here at Leeway have been relatively constantly issuing warnings about market behaviour because the market structure presented itself in a most unpleasant manner.
Last week, in the night from Wednesday to Thursday, then after the dynamic recovery from the previous week's low, I thought the dangerous phase was over - on the last day of this phase in which the market showed strength.
Why? One reason was sentiment: after investor sentiment had been overheatedly euphoric around the turn of the year, it had turned around the week before and was clearly in pessimistic territory. This was accompanied by a long-term buy signal in market timing. In the long-term signal, such a signal ultimately means that the balance between buying and selling on the day in the market breadth is clearly shifted towards "buy".
So there was enough gas in the tank for a long-term move (pessimistic sentiment), there was a clear push in the direction of a breakout (long-term buy signal) and the market had both relieved the over-extension to the upside (consolidated) and dynamically negated the previous weakness. In the process, the price placed itself above the major resistance area (red). Accordingly, my gaze was directed upwards.
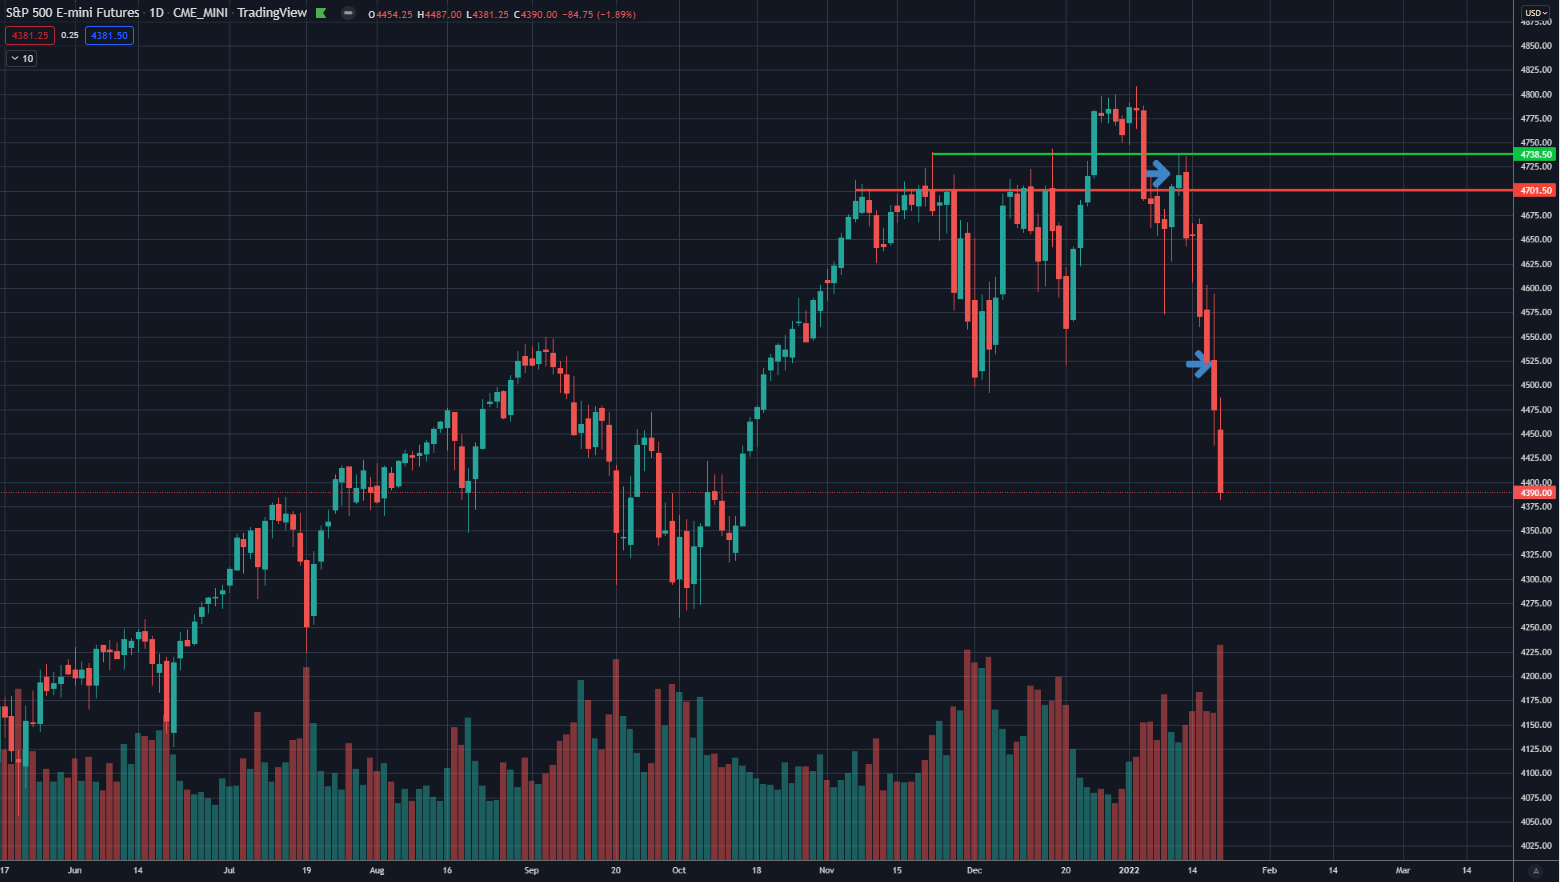
S&P 500 daily candles
In retrospect, I should have waited for the confirmation and final breakout (above green) on the following day, as the situation turned out to be a textbook bull trap (upper arrow). In the night to Thursday (lower arrow), the medium- and short-term buy signals also became active, since then we have been in a clear exaggeration situation. At least the stock of the week demonstrated the advantage of good entries through chart technique and lost less than 1 % compared to the 5 - 6 % loss of the US market.
But enough about the past - let's look to the future. The first focus here is the rekindled theme of value vs. growth. Since the beginning of the year we have seen a massive shift towards value. In the chat we discussed the topic in the old year and diversified the portfolios towards value. The subsequent movement was nevertheless unprecedented. However, the shift had started much earlier, best seen in the chart of the ARK Innovation ETF.
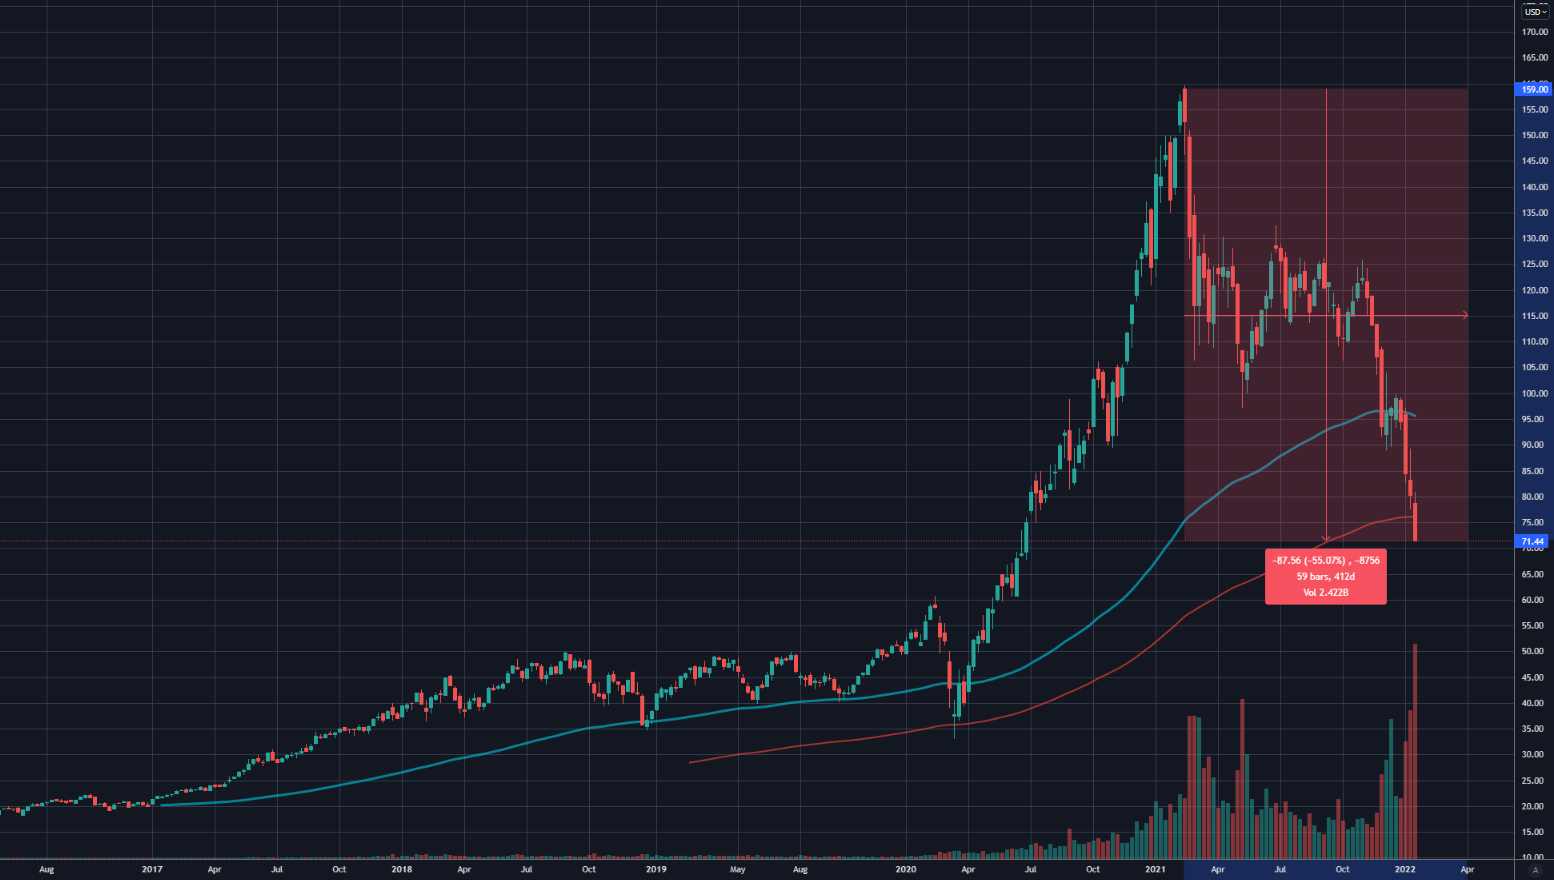
ARK Innovation daily candles
ARK Innovation, Cathy Woods' flagship fund and one of the most talked-about funds of the past year, had risen to prominence by betting on the hottest hype companies post-Corona with extreme returns. The fund has since lost more than 50% of its value since its high in February. The last few weeks mark only the last drops of losses here, no doubt triggered by the outflow of funds from the many copy-cat funds.
The flight from the extreme growth sector should end here for the time being. The crash was too extreme and the topic is now too much in the media. The rebalancing at the beginning of the year brought renewed momentum, which is now coming to an end. In the short term, now is no longer the time to set up the portfolio in a more defensive and value-oriented way. Another area, however, was similarly overstretched as the ARK Innovation universe: cryptocurrencies, of course. And here, there is still plenty of room to fall. In the chart, the Top 30 Global Cryptos. Not a pretty picture: the Great SKS from August to January has been triggered, as long as the price remains below the green line, there is still a lot ahead (or below) us here. Target 6000 points, -60 %.
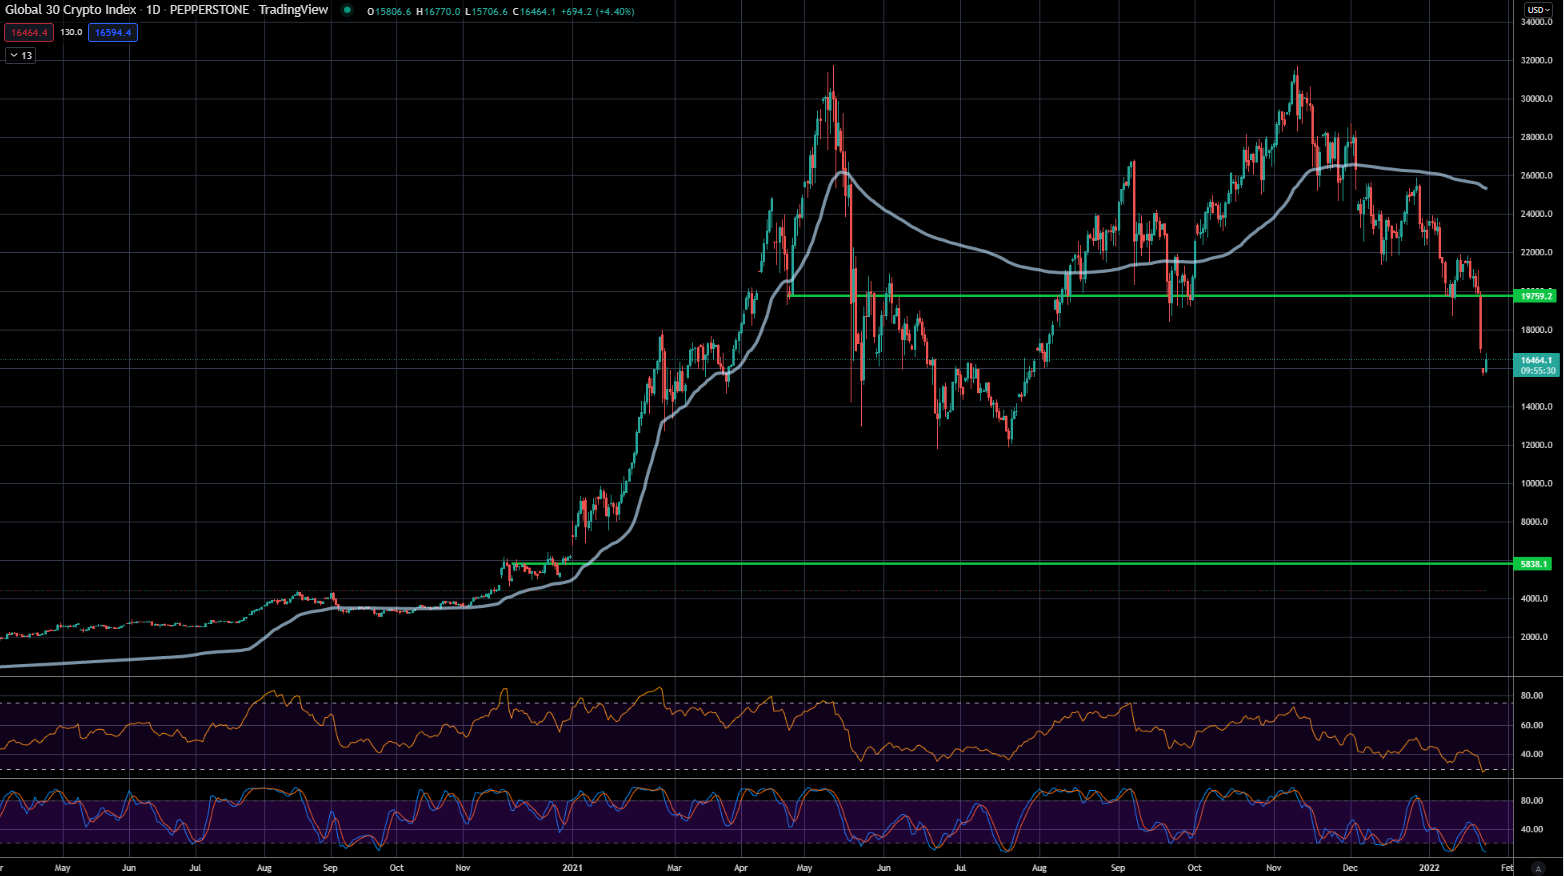
Top 30 Crypro Basket
A little further into the future, however, it might be very appropriate to orientate further in the direction of value. Value does not have to mean boring at all. With our value screener you can easily find highly interesting stocks. How about a US semiconductor and chip company, a beneficiary of the chip shortage in a long-term uptrend, solid margins, 35% debt, over 70% equity, almost €85 billion market value, a P/E of less than 20 and a P/B ratio of less than 2? I will take a close look at Micron Technologies (#3 US Tech in the value ranking) when thinking about value. The drop is certainly smaller than for Nvidia and AMD.
Ready for Better Investment Decisions?
Start your free trial today - stock analysis with artificial intelligence.
Full Transparency | Full Access | Cancel anytime
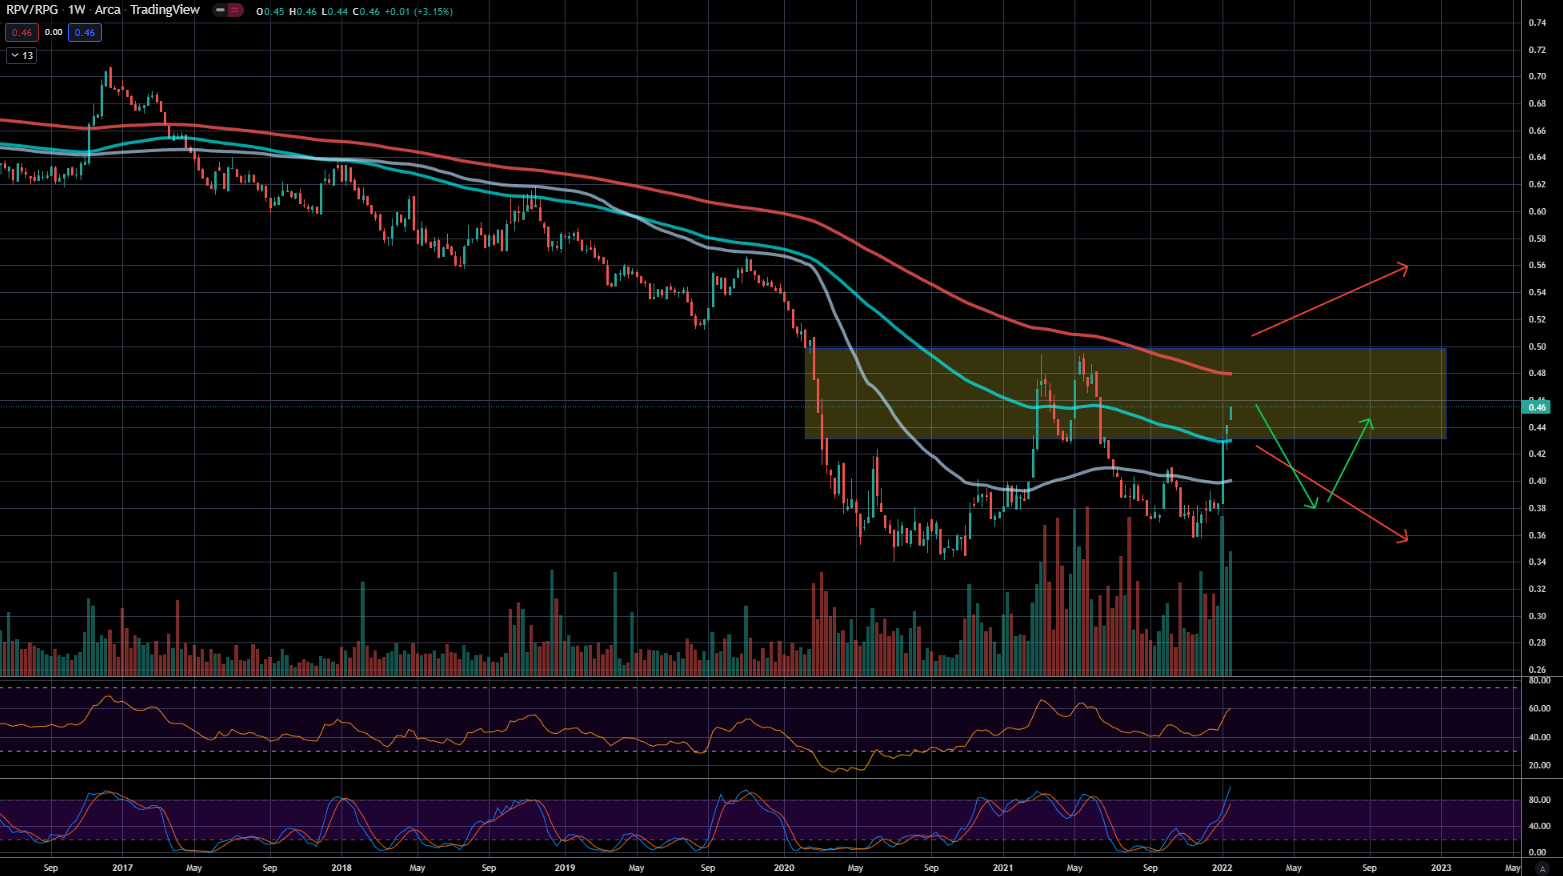
Value vs. Growth long-term chart. Resistance area in yellow and preferred scenario are the green arrows.
Turning to the broader market, while Europe and Germany in particular held up well, the US side, as mentioned earlier, suffered drastically. Investor sentiment is historically pessimistic as a result and since Thursday we have been in a clear short-term downward exaggeration. Where we are here can be seen beautifully in our latest feature. Every day we determine the historical points in time when the situation is most similar to the current one. I have compiled the five most similar points in time.
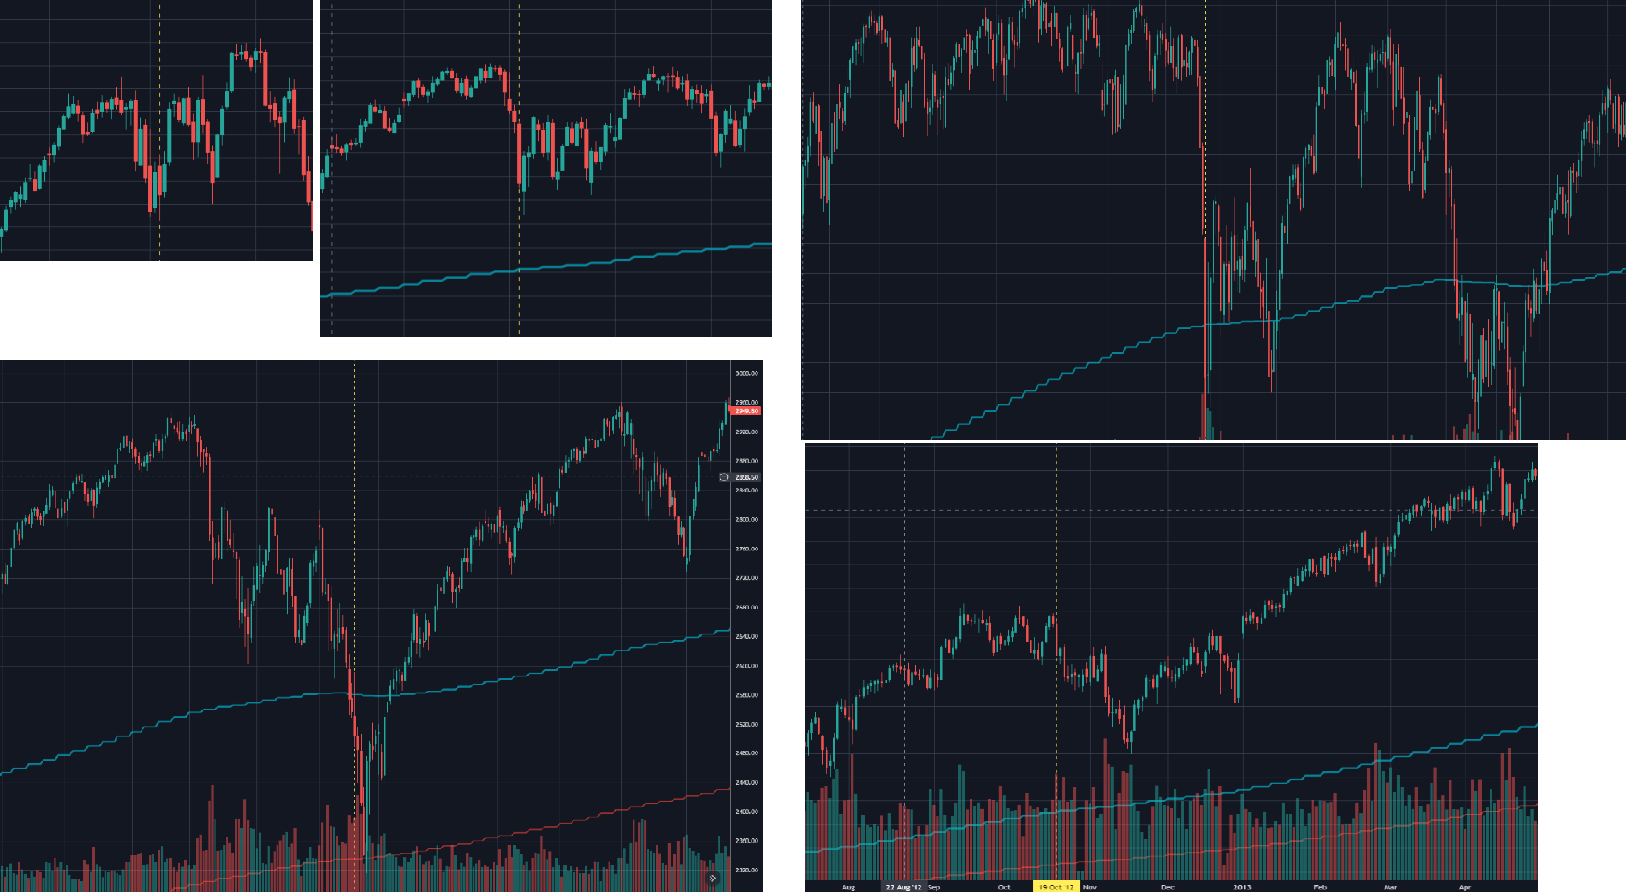 Most similar points in time in the S&P 500. From top left to bottom right: 13/12/2021, 05/08/2019, 24/08/2015, 19/12/2018 and 19/10/2012.
These instances are spot on with my personal assessment. We are at the end of a downtrend. Either we see a very dynamic countermovement here for a few days that doesn't make it to new highs but continues to digest this initial shock. Or we slide further through here (bottom left), in which case we are in really extreme territory at the end of crash moves (like Christmas 2018 just now) and could expect a months-long upward move.
Personally, I favour a mix of 2015 and 2012 (top and bottom right). First a dynamic counter-movement that ultimately fails, only to start a second downward wave in about 2 weeks that takes us another 10% lower. This would also complete the expected 20 % correction this year. The European market will probably not be able to escape this second wave. In this context, it is important to take another look at the dollar index DXY, which I had already focused on at the beginning of the month.
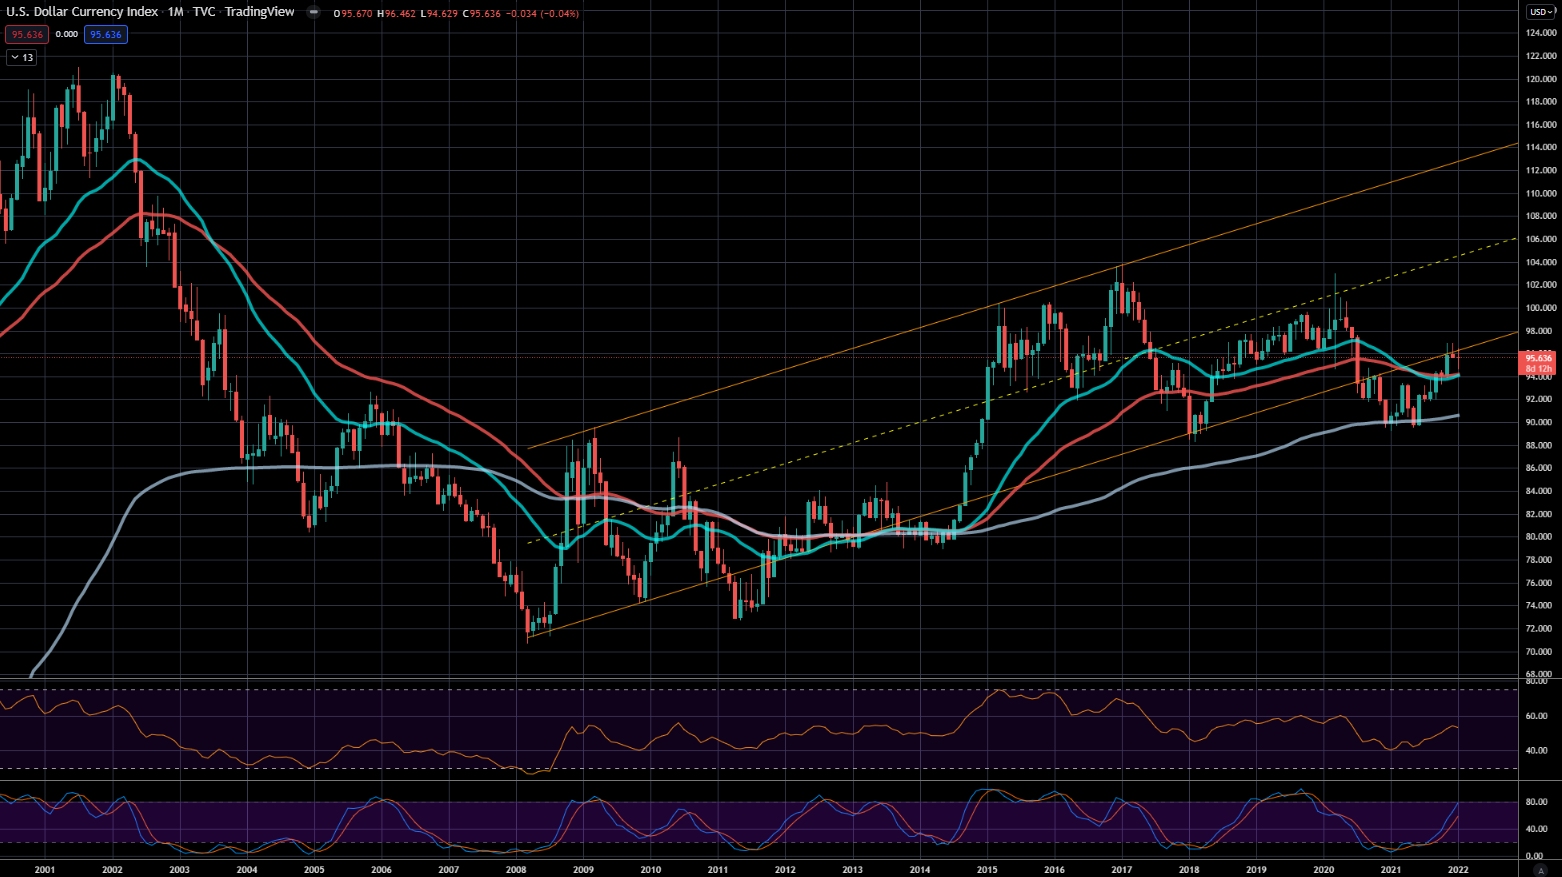
It is showing strength again and could make a run for it to break through the important resistance at last year's highs. This behaviour could well explain the relative weakness of the US markets versus Europe. However, as noted in the last commentary on the Dollar Index, a strong dollar has historically also been a significant negative factor for Europe and the emerging markets.
In short, I am buying here to exit the market trending up a few percent in a few days to weeks. And I am overweighting aggressive growth to increase the value ratio in a few weeks to months.
Good luck!
Lars