Right off the bat: we are still in the process of finding direction and the level in the VIX has still not been broken so far. Nevertheless, the situation is showing itself from a new perspective and we see analogies to March of this year. Previously, my view of the market was rather cautious. We increasingly saw signs of overheating. The market timing showed isolated warning signals again. The chart of the S&P also made me cautious:
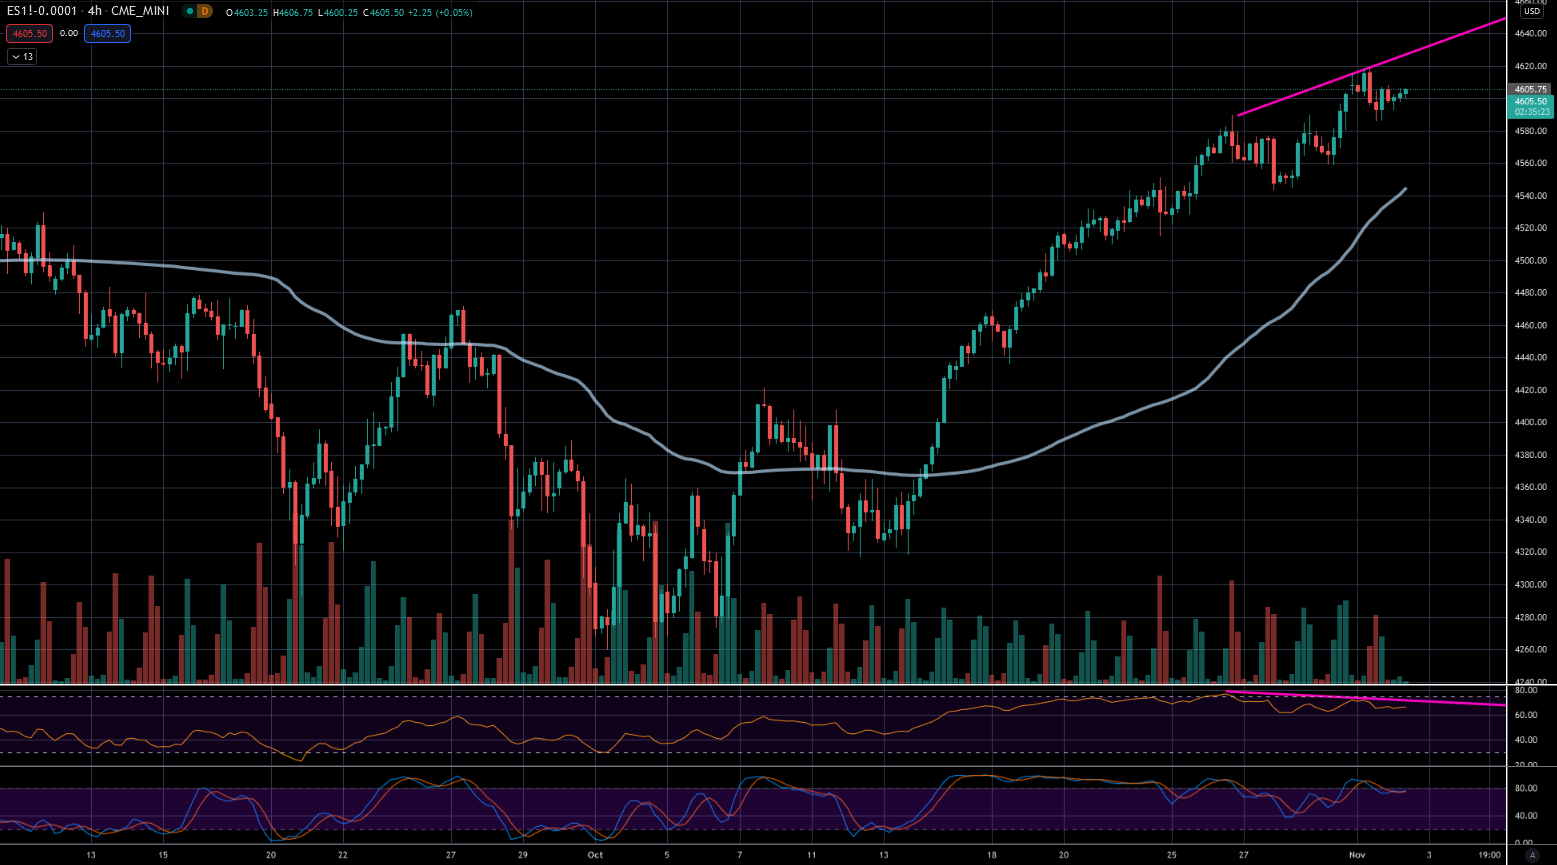
In recent days, the index broke out above the old highs at ~4550. Instead of a dynamic movement, however, we saw increasingly volatile shuffling paired with the mentioned warning signs in the market signal. At the same time, the VIX rose in anticipation of more volatility and confirmed once again the resistance at ~15 points. Yesterday, a divergence in the RSI in the 4-hour chart was added with the higher high of the opening with declining RSI. In itself, I consider this behavior as an expression of significantly increased downward potential and flirted with a short position with SL above yesterday's daily highs. All the more surprising was the buy signal in both the short-term and long-term time frames that our market timing delivered last night.
Time therefore to reconsider the previous perspective. A very interesting insight is provided, for example, by the Global Dow. The Global Dow is a 150-stock index of companies from around the world created by Dow Jones & Company. The index contains only blue-chip stocks and the picture here is simply brutally beautiful.
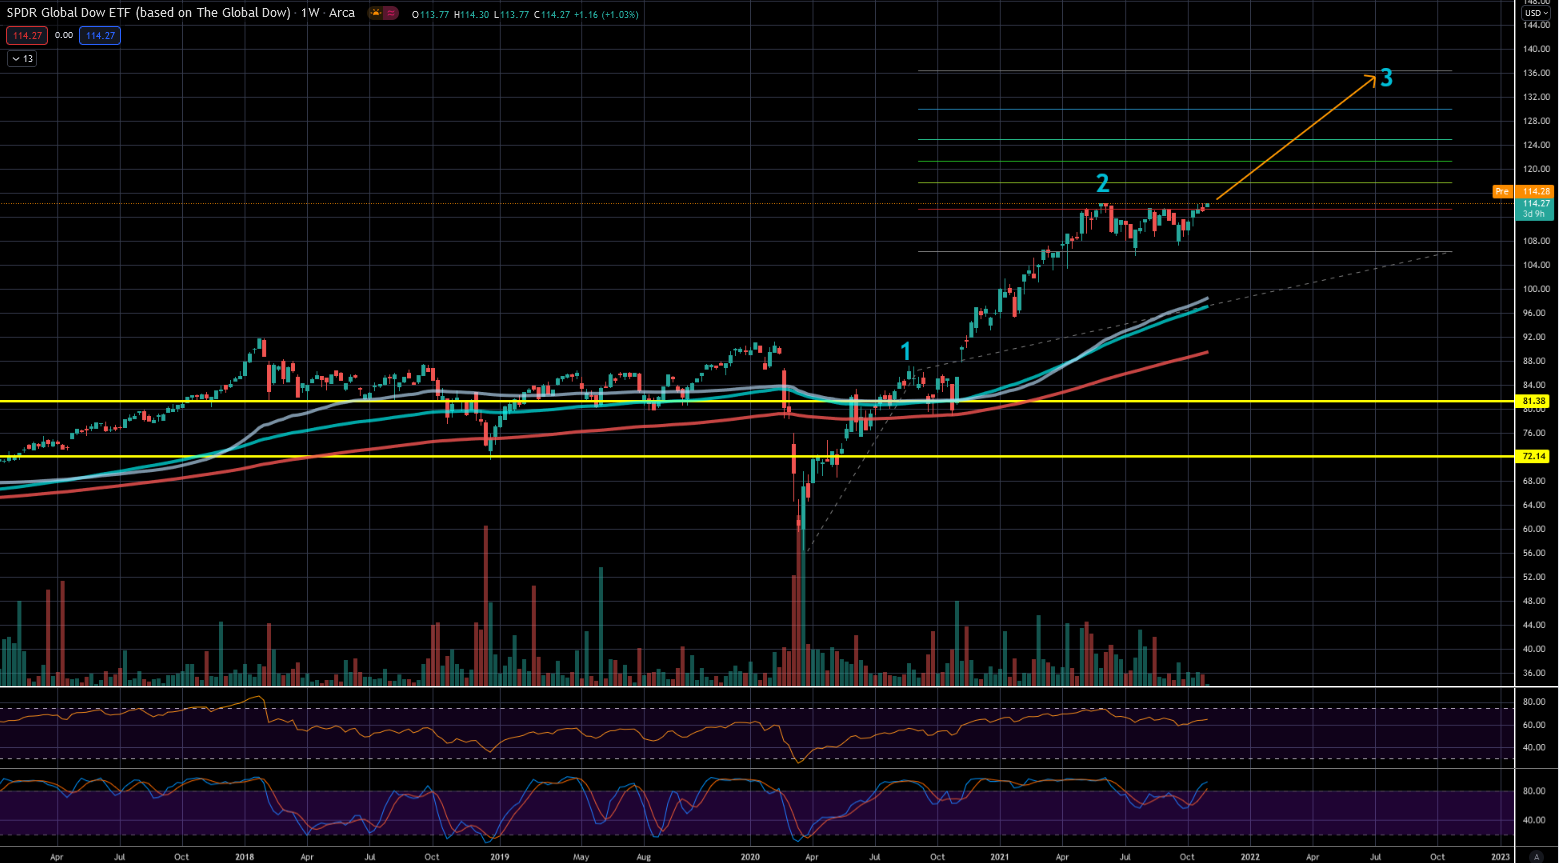
The Dow Global currently shows a continuation formation that could hardly be more perfect with a price potential of around 20%. It would be a classic 1-2-3 movement from the Corona low. The tight consolidation since August, which has developed into an almost symmetrical W, was triggered last week by the break and holding of the neckline. A possible trade here would already be an entry with a stop loss ~5% lower. With just under 20% potential, we see a very acceptable risk-reward ratio (R:R) of 3 to 4 to 1.
The American small-cap index Russell also shows an impressive consolidation that CAN already be interpreted as triggered:
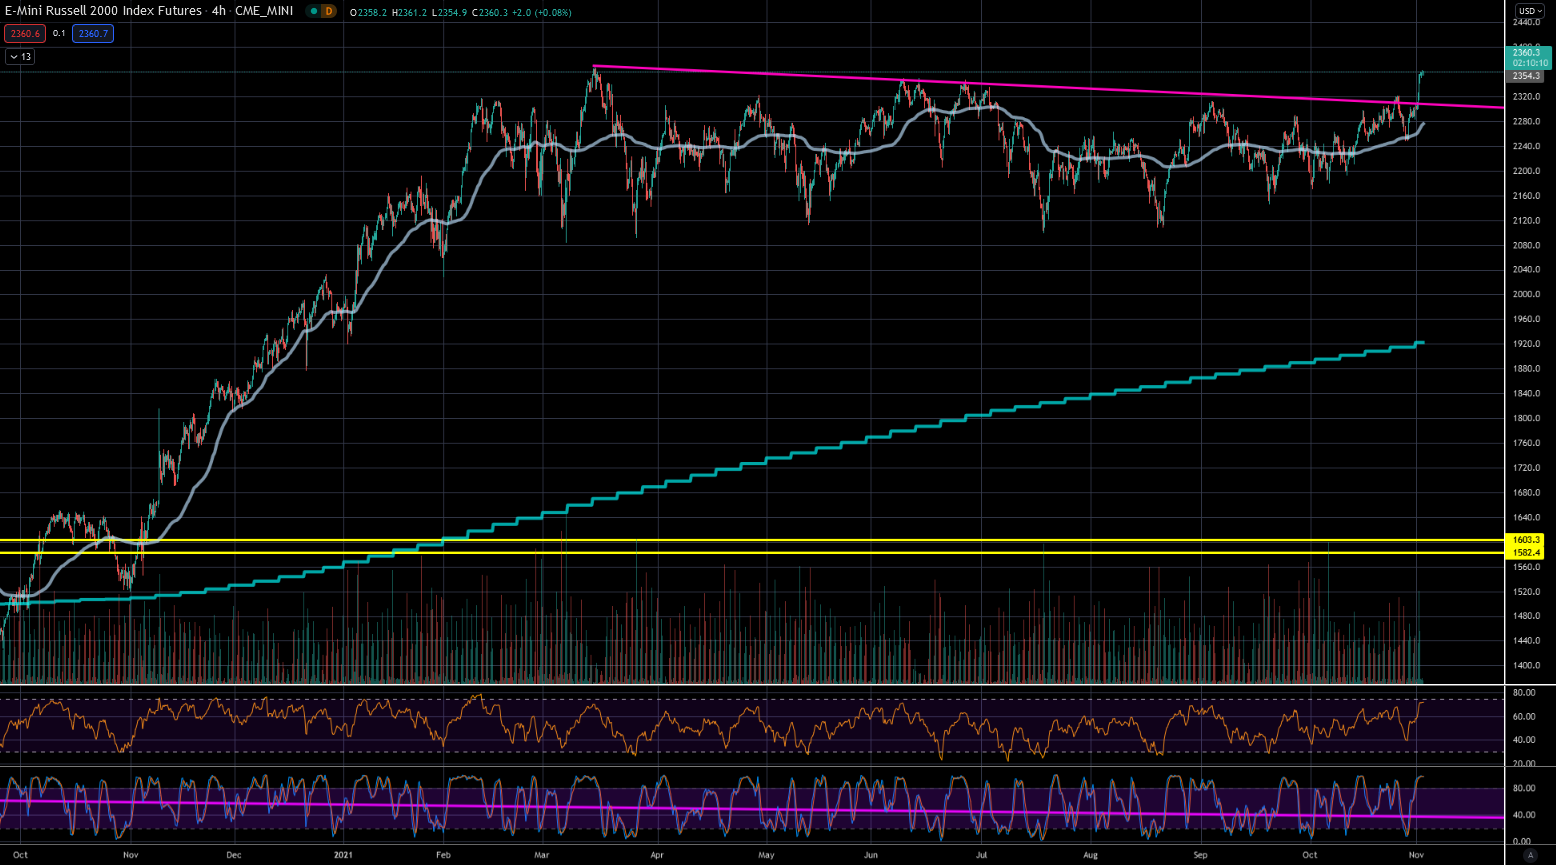
Here too, one could set up a nice trade with a SL below the low of the previous week (~2240). Personally, however, I would prefer to wait for the retest of the breakout. This brings us back to the S&P 500. The price has so far followed the original bullish scenario wonderfully:
Ready for Better Investment Decisions?
Start your free trial today - stock analysis with artificial intelligence.
Full Transparency | Full Access | Cancel anytime
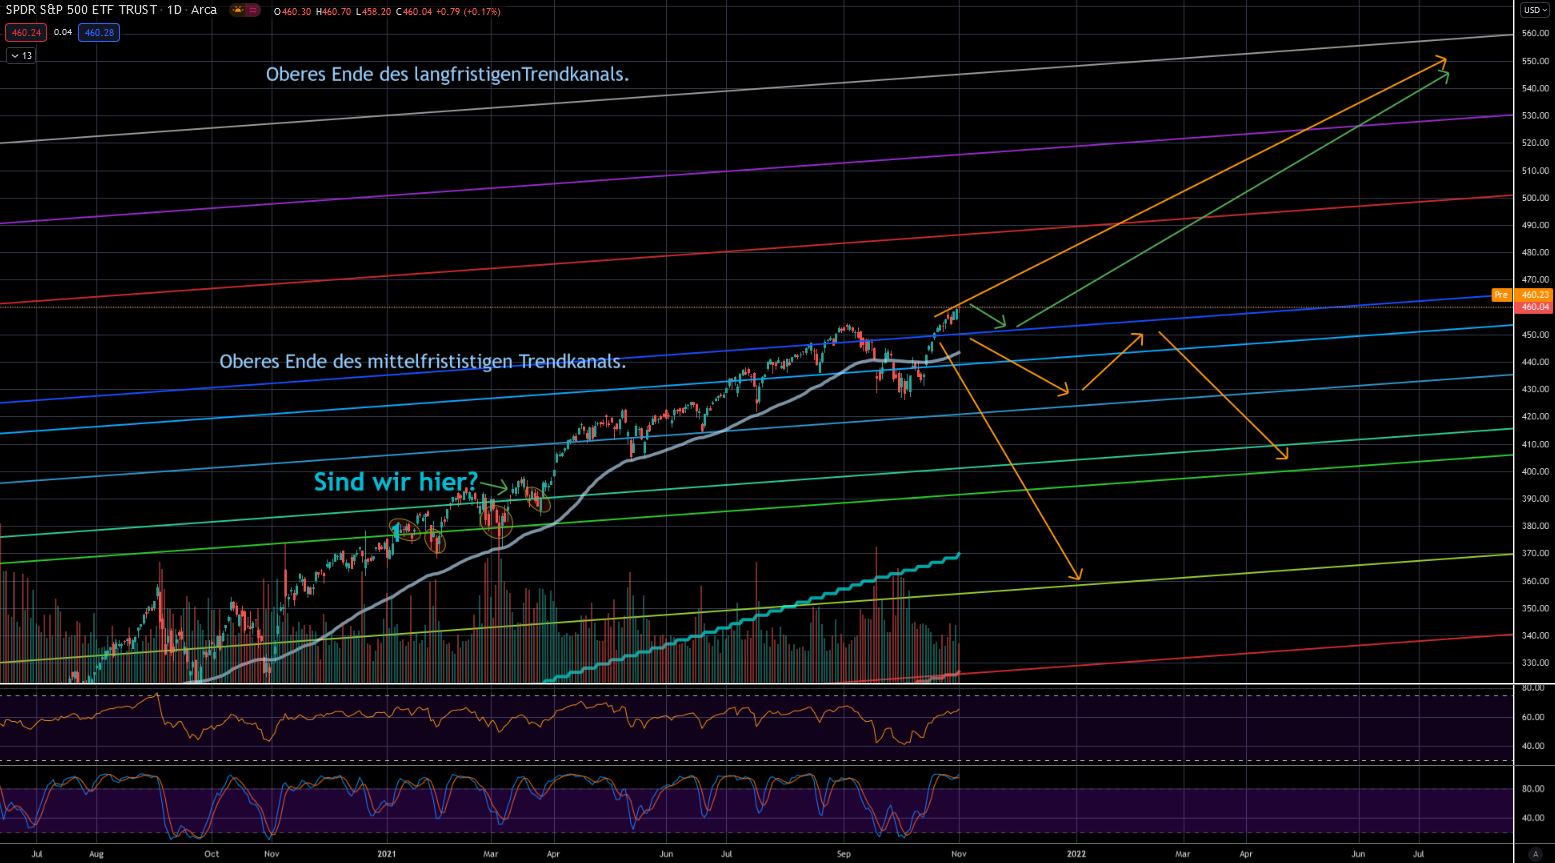
Much points to a successful breakout, however this must be confirmed in the next pullback by a successful retest and this retest should then finally also be accompanied by a VIX below 15 points. For this, I have added the refined scenario in green. With this, we would now be approximately at the same point as on March 11th of this year. Here too, by the way, the VIX struggled with an important level at 19 points, which was only broken after the successful retest.
It is times like these when I am particularly pleased about the market timing signals. I don't have to worry about whether I'm missing a move. I simply trade the strategy and wait patiently to see if the retest comes.
Much success!
Lars
Disclaimer: Lars Wißler holds positions in the mentioned securities. PWP Leeway holds no positions in the mentioned securities.