The Valneva case shows how closely one must monitor such investments if one wants to make them. In hindsight, the turnaround from hype rally to crash was easy to recognize. However, in hindsight, many things are easy to recognize that are very questionable during the events. In this article, we will first look at the signs of the crash in chart analysis to better avoid such mistakes in the future. Subsequently, we will discuss the probable further price behavior with its opportunities and risks.
The Rally
From mid to late August, Valneva launched a fabulous rally from the sideways consolidation since February and rose by over 100% within 2 weeks. Already at the end of last year, the price had doubled from 6 € to 12 € due to hopes for a new vaccine. The hope was not unfounded: a "conventional" vaccine for doubters and skeptics of the new methods with mRNA or vector technology. Valneva's vaccine is a whole-body or inactivated vaccine according to the well-known method. Complete, killed pathogens are injected to start antibody production.
The signs at the end of summer looked excellent with a vaccine in phase 3 of clinical trials and, among other things, an already existing order for 100 million doses by the British government. With the breakout from the sideways movement between 10 and 14 €, massive volume came into the stock and pushed the price to 25 € within two weeks. The trigger was the news that Great Britain had approved the vaccine for a rolling approval process. In the following days in early September, there were two clear signs of danger or at least an end to the rally.
Exhibit 1: Divergence
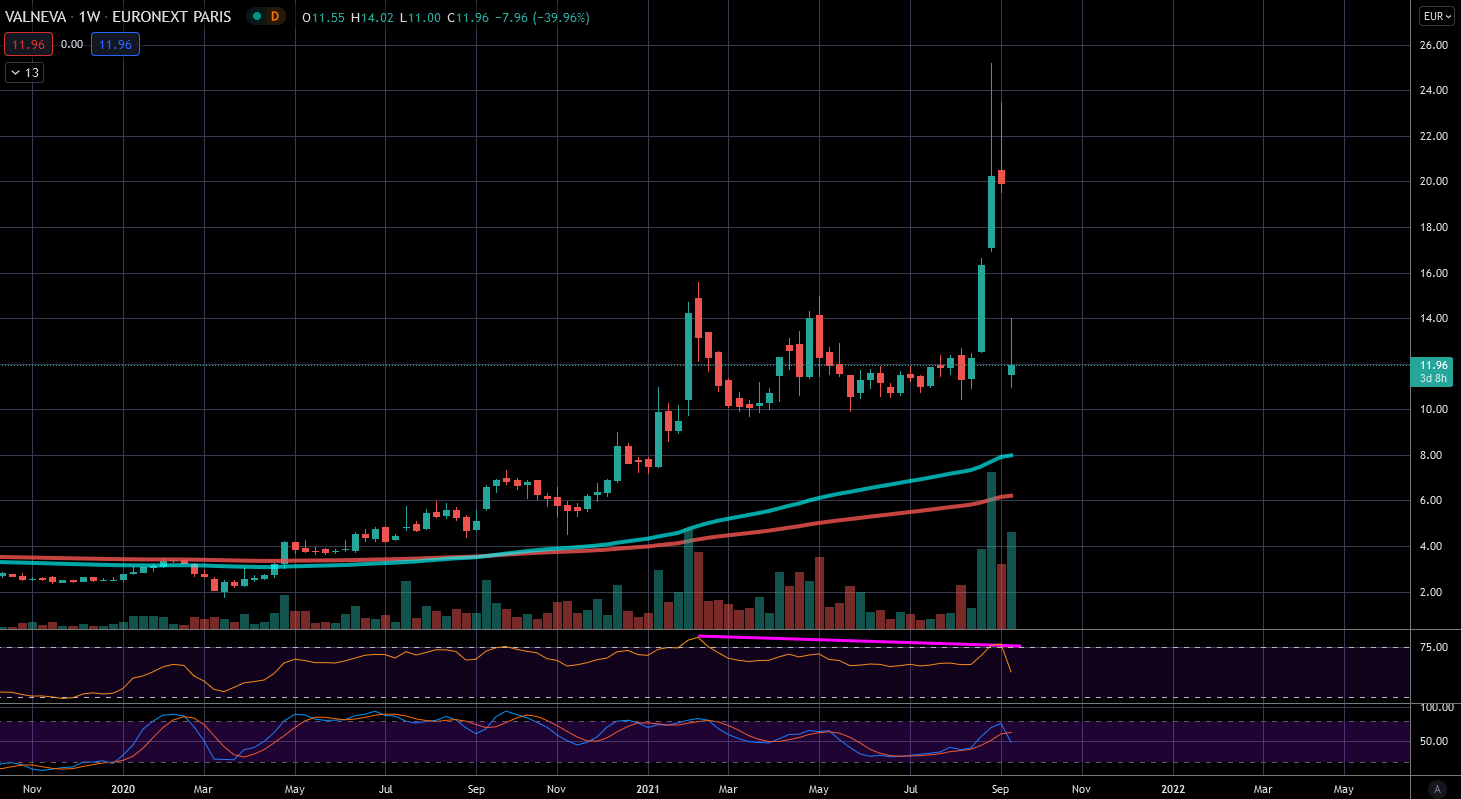
The RSI showed a divergence in the weekly view between the high in February and the high two weeks ago (marked in pink). While the price marked a higher high, we saw a lower high in the RSI. An indication of weakening momentum.
Exhibit 2: Volume
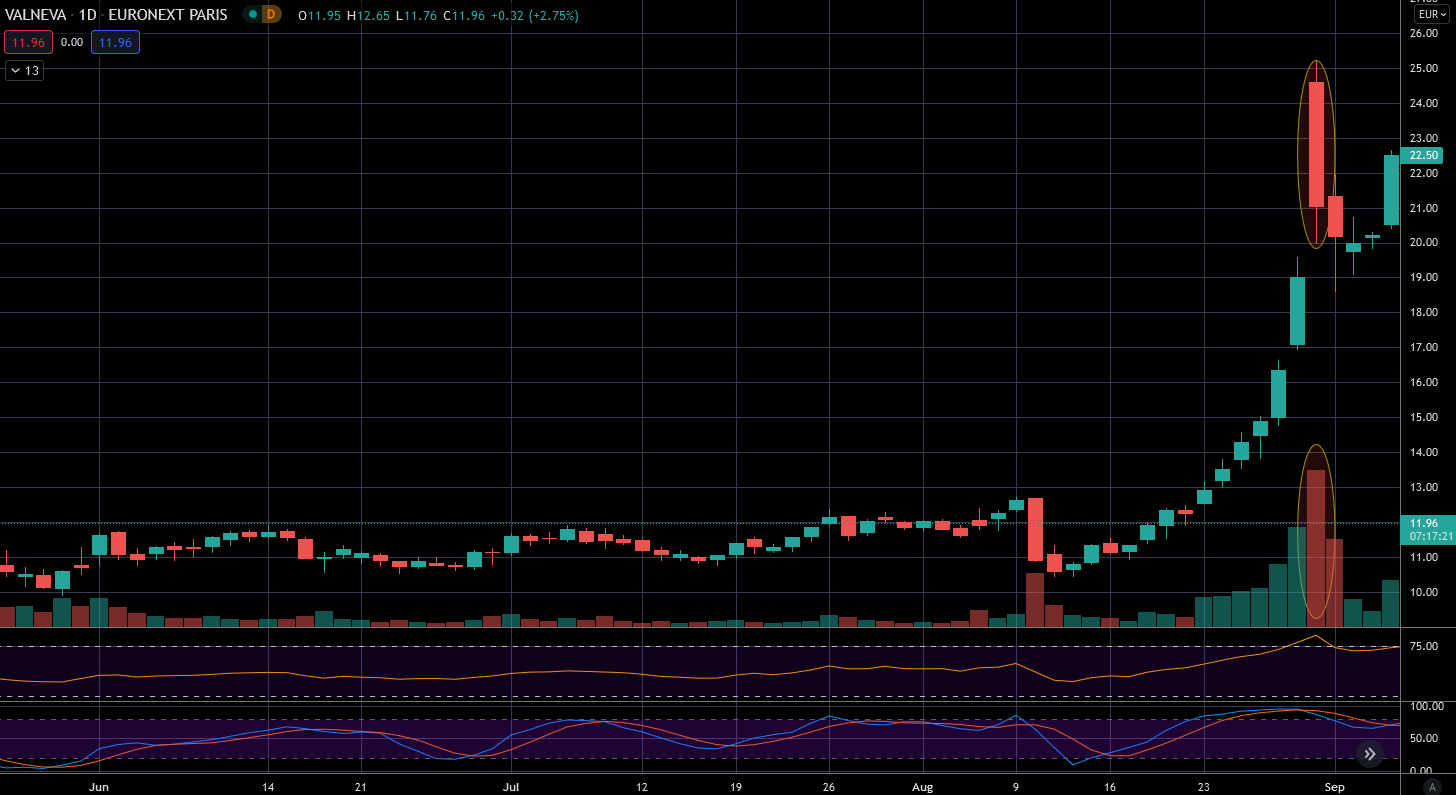
The massive gap-up on August 31st was sold under extreme volume. A lot of money took profits here. The price could not confirm the initial euphoria of the day. Big money said here: enough profit, take it and move on.
The Crash
The stock could have continued to consolidate at this point. It was waiting for the next catalyst. But this came in the form of bad news: Great Britain cancelled its large order with the justification that Valneva had not complied with the contract terms. Just three weeks after the start of the approval process, this is a catastrophic signal. The background is unclear, the British government wants to comment only after talks with Valneva are concluded. Here, all investors with connections now have massive advantages. The price has so far fallen to a particularly clear technical formation.
Ready for Better Investment Decisions?
Start your free trial today - stock analysis with artificial intelligence.
Full Transparency | Full Access | Cancel anytime
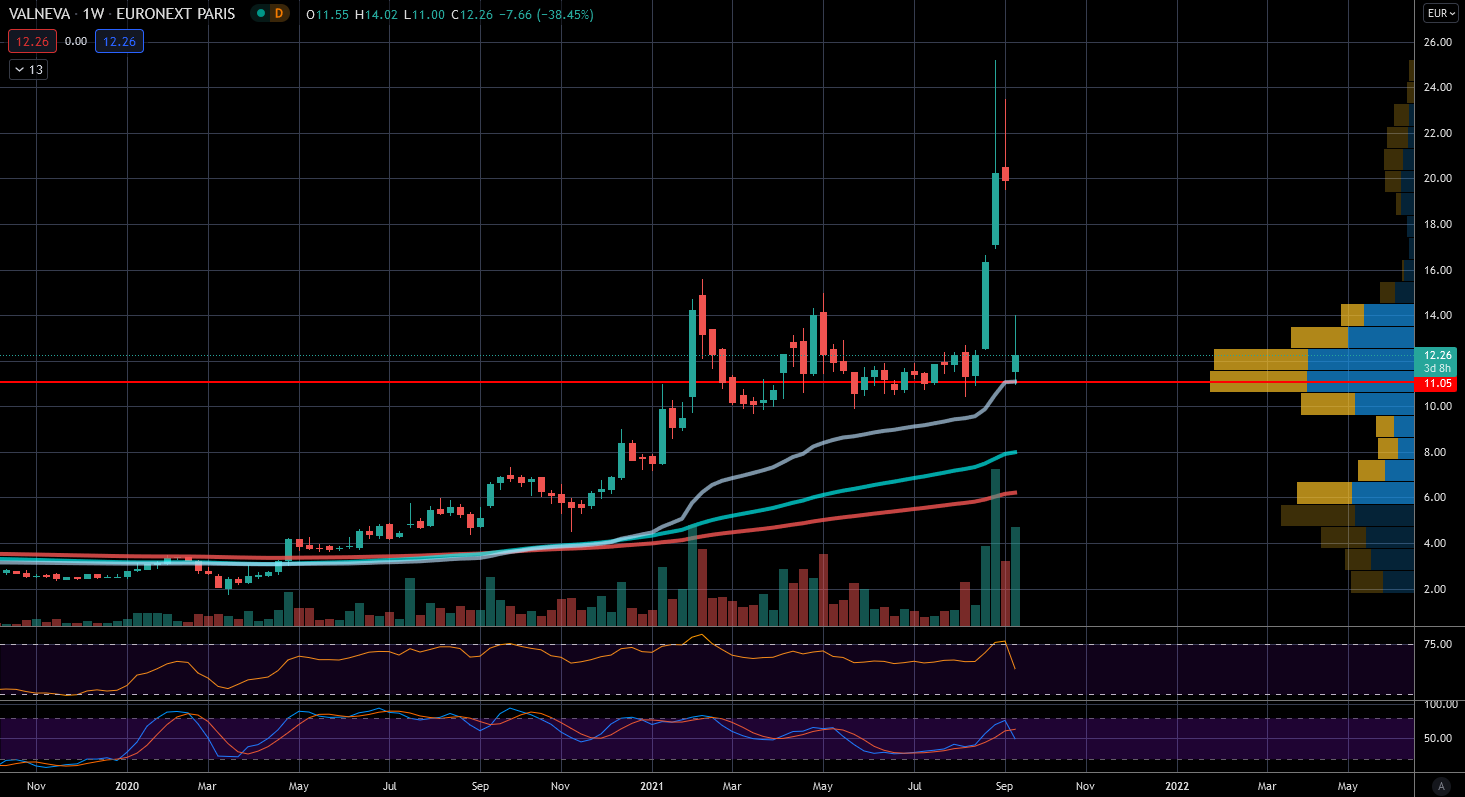
At around 11 € lies both our dynamic moving average in gray, as well as the Volume Point of Control of recent years. This pause therefore has more to do with chart technicals and very little to do with the fundamental situation. Therefore, one should act more technically at this point. The resolution based on facts will only come when the British government provides clarity after speaking with Valneva.
What Now?
One must not overlook how enormous the news of the order cancellation is. Valneva had just barely moved into the profit zone, but invested heavily in vaccine development against Corona and posted a loss of around 85 million € last year. Great Britain was previously the only secure customer. The EU had announced a purchase in winter, but so far this has not yet become reality. Valneva has other vaccines in the pipeline, in particular the company is the only one with a vaccine against Lyme disease in development.
However, there is a big question mark as to whether Valneva has not overextended itself if the Corona vaccine is not successful. The debt at over 300% is not extreme but clearly elevated. The technical mark around 11 € is massive. Should the price sustainably break through yesterday's lows, the next support is probably only about 50% lower at around 6 €. This is where the slow moving average waits, paired with the next volume area.
To the Leeway Wikifolio - Global Selection with Artificial Intelligence.
Lars Wißler does not own any of the mentioned stocks. PWP Leeway does not own any of the mentioned stocks.
Author: Lars Wißler, PWP Leeway, Managing Director and Chief Analyst