At Leeway, much revolves around testing: We start with a theory, test it, correct it, test again. This applies to our analyses, but also to the presentation of our information and the design of our user interface. One of our main findings: less is more - even when it comes to information about stock investment.
You can see the result of our strategy, in which we neglect information without proven added value, in our model portfolio.
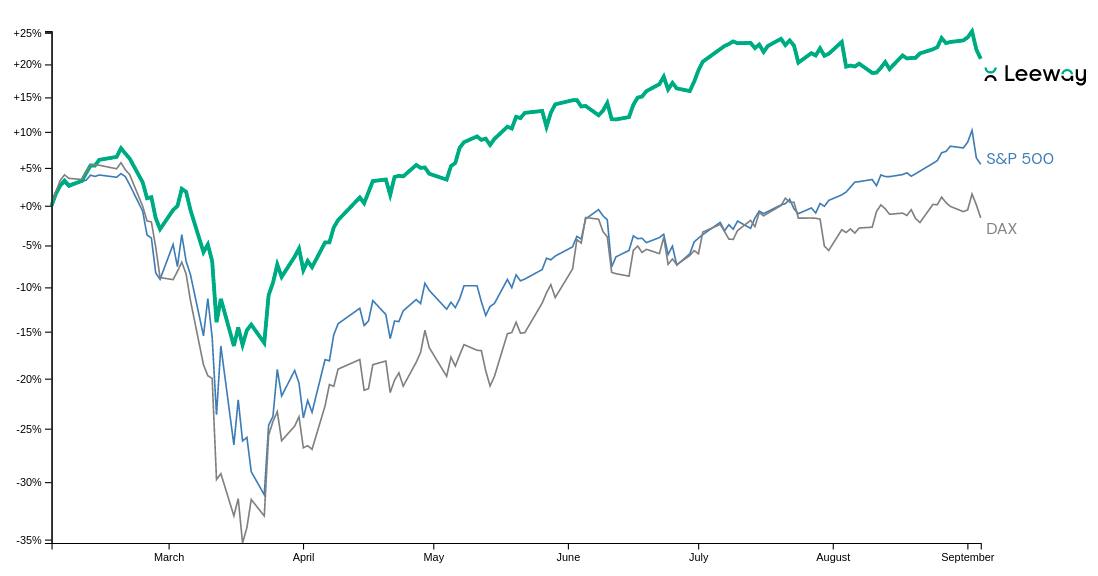 The chart shows the performance of the Leeway model portfolio compared to selected indices: 33 stocks from around the world selected solely based on fundamental valuation, without rebalancing since the beginning of the year.
More information increases cognitive load.
Less information leads to better decisions? That may surprise many readers. In fact, in most cases it is assumed that more information automatically enables better investment decisions. However, “more” information initially increases the cognitive load that every user faces in their decision-making process. As a result, decision factors are often neglected or weighted incorrectly. So-called biases arise. Additionally, the higher cognitive load also reduces the confidence with which an investor makes their decision. This leads to fear of losses, which primarily results in stocks being bought too late or sold too early (disposition effect).
That's why we conducted a study in 2020 in which we developed an interface based on scientific theories about the behavior and cognition of retail investors and tested it on users. The goal was to gain insights into how we can support our customers in making confident, objective decisions. The result is the clear and reduced user interfaces for which we now receive a lot of positive feedback.
Too late, too opaque:
why we can generally neglect news.
Furthermore, certain types of information statistically offer no greater advantage for predicting price movements. This brings us to the next big surprise: the overvaluation of news. In fact, our customers repeatedly ask why we don't display news on our website. This is mainly because news generally reaches retail investors too late compared to informed circles. As a result, the market has already reacted to the news when pricing it in. Furthermore, content is difficult for outsiders to verify and interpret.
To create a portfolio that performs better than the average stock development, we don't need to know all information. Because even if we buy a sufficient number of stocks at random, our diversified portfolio will develop roughly like the market. While we won't be successful with this, we also won't be “unsuccessful” (unlike the average retail investor, who performs significantly worse than the market).
Our strategy:
Combine success factors, avoid mistakes.
In addition to randomly selecting stocks, we can now include criteria that ensure our random portfolio performs a little more successfully. Such a criterion is called an edge, an advantage. It is actually sufficient to include just one of these criteria in the stock selection to outperform the market.
Conversely, however, this also means that by using a criterion that influences our selection suboptimally (essentially an “anti-edge”), the portfolio's performance can fall below that of the market. To beat the market, it is therefore important not to use information and strategies that negatively influence the selection. A small set of successful criteria therefore beats many criteria, some of which are good and some of which are bad.
That's why we only show information where we can statistically demonstrate a significant advantage over a sufficient range of hundreds of occurrences. Our Leeway Score is the quantification of the advantage that a criterion provides compared to an average stock investment.
Ready for Better Investment Decisions?
Start your free trial today - stock analysis with artificial intelligence.
Full Transparency | Full Access | Cancel anytime
Explanation using the example E.ON
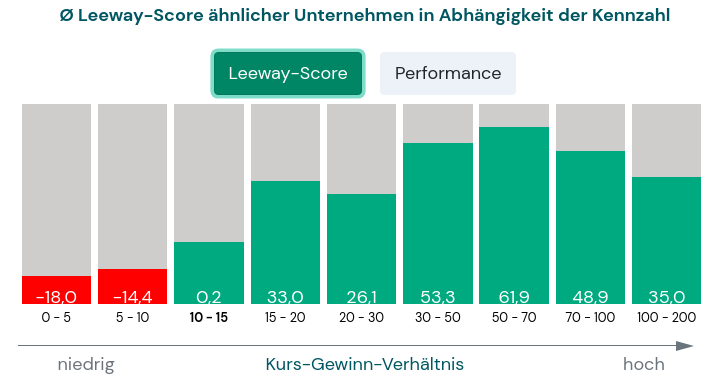
In this image you can see the statistical impact of the price-earnings ratio on the return of a stock. In this case, we are looking at stocks of the E.ON type. During recent years, a P/E ratio above 15 led to a significantly above-average return within the next two years, while a P/E ratio below 10 was a sign of below-average returns. The optimal range is a P/E ratio of 50 to 70, a range that most people would intuitively judge as far too expensive and thus decide against buying the stock.
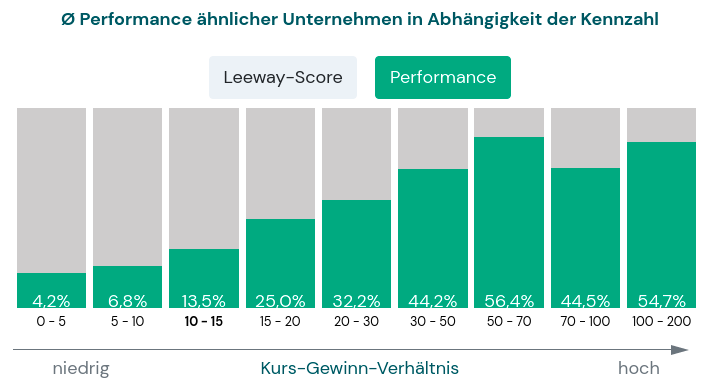
Even if you only look at pure performance and disregard other quality criteria of our score such as stability and probability of occurrence, you can see a direct correlation between high P/E ratio and high returns. On average, a company like E.ON has generated up to 50% higher returns within 2 years when it had a very high P/E ratio. (You can view the data for each metric and for each stock yourself by visiting a stock's page and clicking on the corresponding metric.)
How to use our information for your personal investment strategy.
With our filter functions, you can display a personal stock selection and ignore all poorly rated companies. Implement the strategy with which you feel most comfortable and avoid bad decisions. Fish in the lake with the most fish. Leeway's objective, data-driven analysis provides you with the framework to navigate the stock market with your very own personal approach.
So should one simply reduce information as much as possible? Certainly not! We are much more concerned with showing only that information which is actually (and that means statistically as well as psychologically) relevant. The result is a clear and minimalist interface, scientifically optimized analyses with reliable results, and not least texts like this one, in which we explain to our users why we do what we do.