The Situation: After ten years of sideways movement in the range of $5 to $35, Jinko (JKS.NYSE) broke out dynamically in the summer and reached a high of $90 in the fall. Since then, the momentum has dissipated and the price is crumbling sideways and downwards.
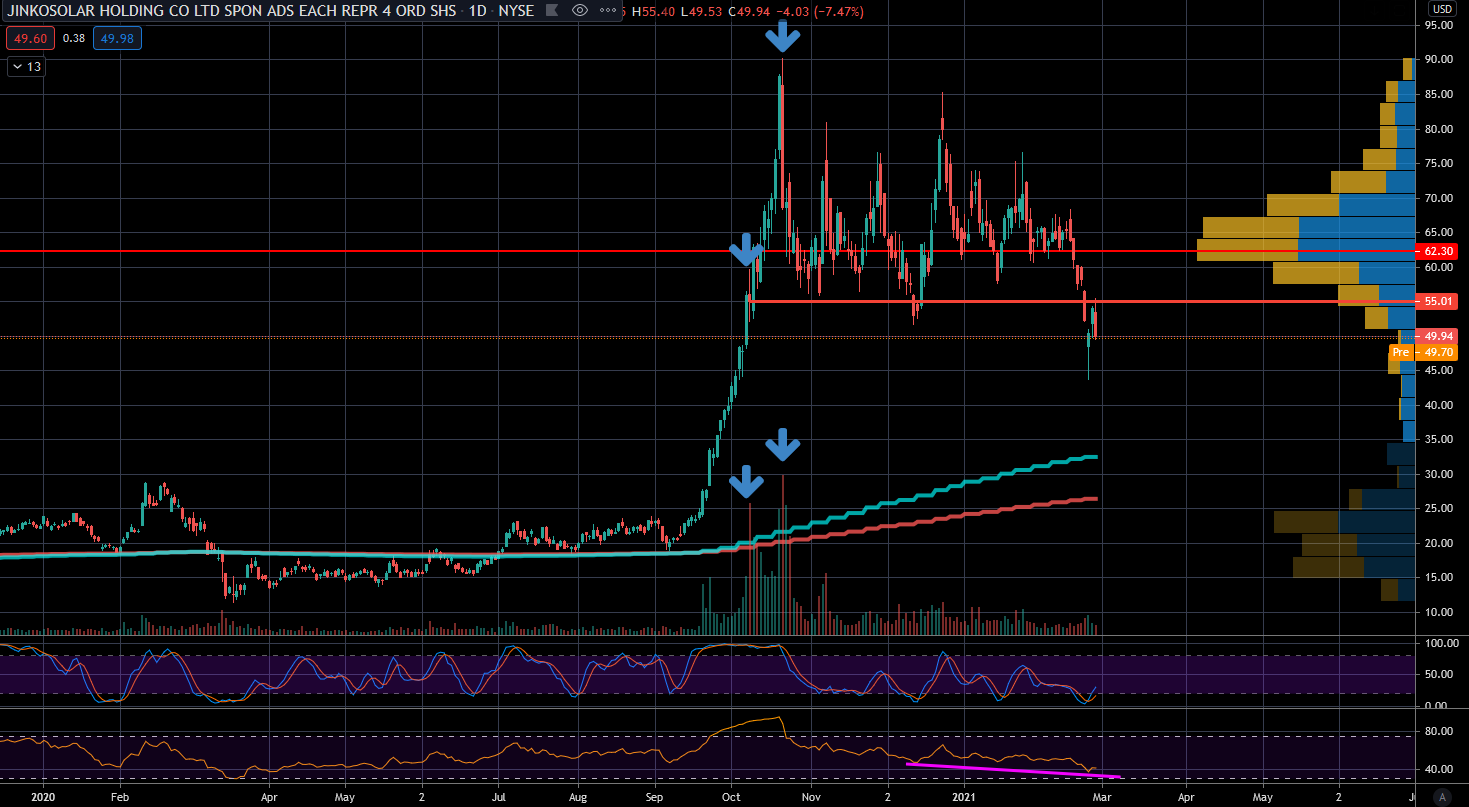
Jinko Solar Daily Candles
The Question: Is the chart situation attractive to open a position now, nearly 50% below the highs?
The Analysis: Positively, there is definitely the dynamic breakout from last summer and the consolidation since the end of October could be a healthy pause for a continuation. However, there are problems in the chart pattern. Trading at the high around October 21, 2020 showed extremely high volume. Here, a lot of money and many shares changed hands. This means many new shareholders entered above $75 and are now significantly in the red. These new shareholders generate selling pressure with every price increase to „still get out“.
A second volume spike can be found at the pause of the uptrend around October 8 at around 55 €. The breakout scenario is therefore not one in which high volume and thus buying interest flowed into the upward movement. Here, an initial surge flowed upwards without major resistance. Until some large positions then used the high prices and the rising interest and thus the rising demand to massively reduce positions.
The price has now slipped relatively easily below the volume mark of $55. The buyers from October have so far shown no signs of coming back and building further positions. At the same time, no increased volume can be found in the downward movements, so there have been no panic-like sales so far that would lead to „fear of missing out“ purchases in the event of a reversal to the north. There is also no weakening momentum or divergence visible in the RSI (purple line) that would indicate an end to the consolidation.
Ready for Better Investment Decisions?
Start your free trial today - stock analysis with artificial intelligence.
Full Transparency | Full Access | Cancel anytime
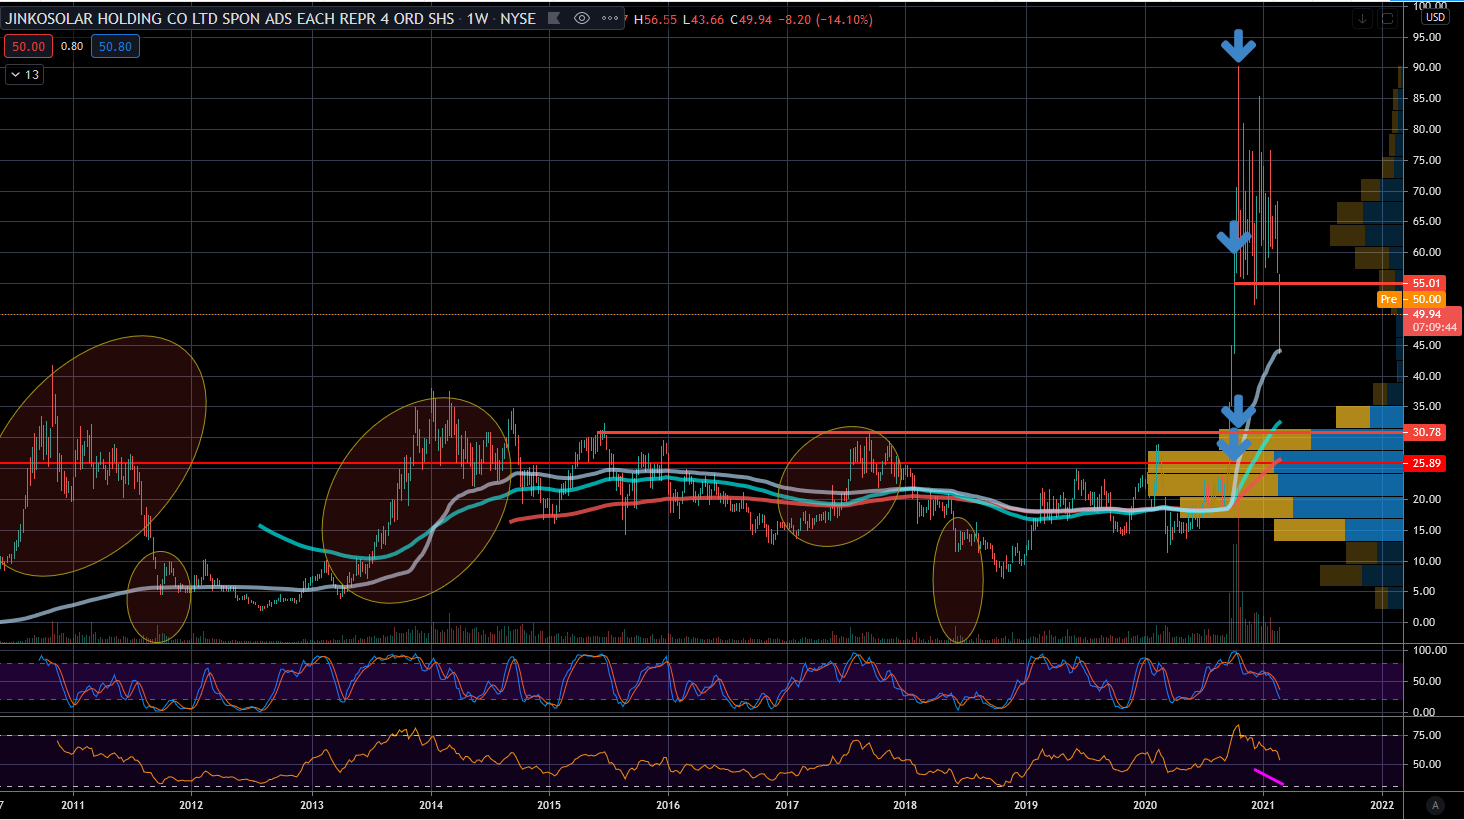
Jinko Solar Weekly Candles
Interesting is the Kaufman Moving Average (gray) in the weekly chart, where the price has now paused in the downward movement. It could serve as a basis for a trend reversal to the north. For this, the price would need to overcome the $55 mark and the selling pressure from the first October buyers. Below that, the next significant support levels are only to be found at ~$30.
Conclusion: Jinko has a history of dynamic rises that end after the first wave and crumble until they run into a panic spike in volume. The movement this time was significantly stronger but the similarity to the previous ones is clear. A second drop below $45 with divergence in the RSI would be an interesting setup for a trade with a tight stop-loss. Otherwise, an entry would simply be a bet that this time everything will be different than before at Jinko Solar.
Lars Wißler does not own any of the mentioned stocks. PWP Leeway does not own any of the mentioned stocks.