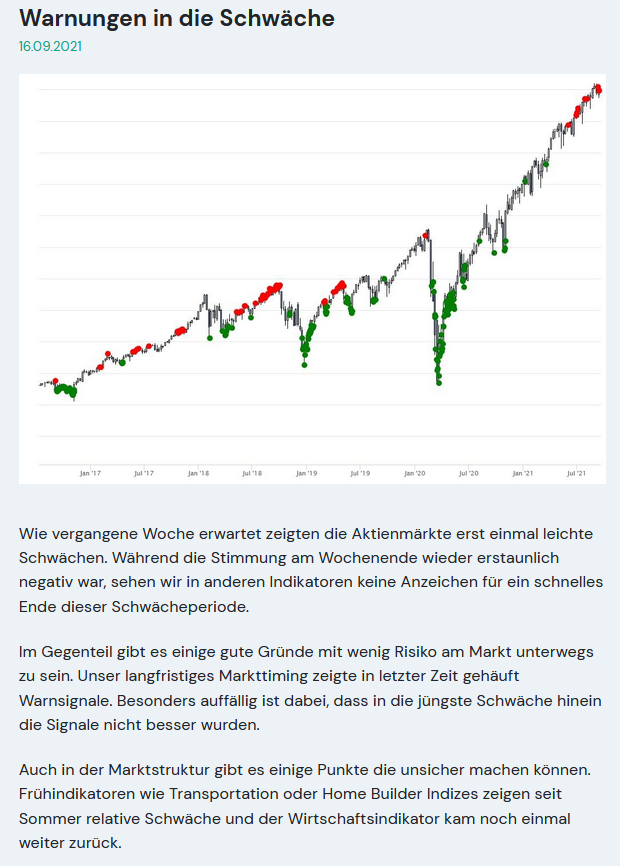
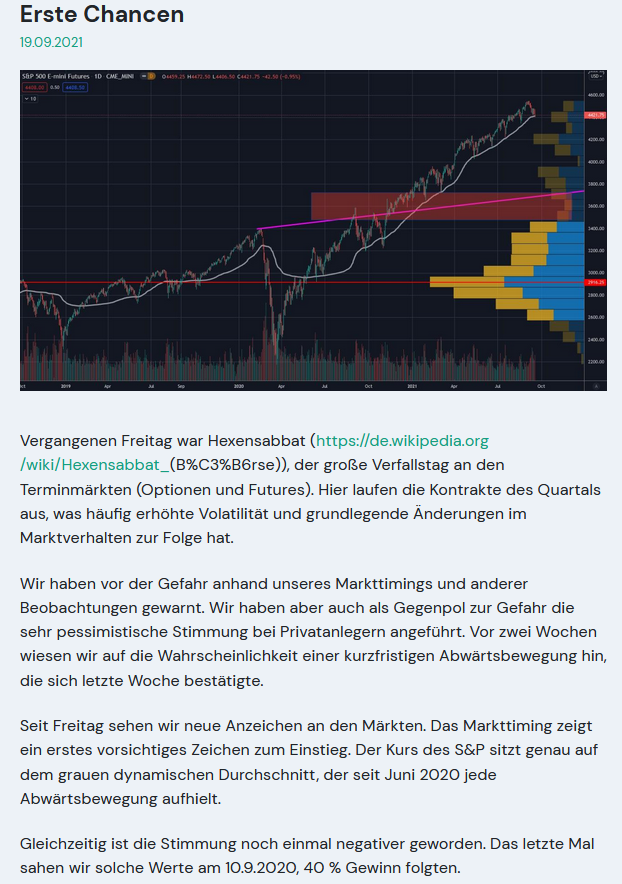
On August 15, we warned of increased risk in the stock markets. We expected a phase of searching for direction with more volatility. The rally of the first half of the year was quite clearly recognizable in advance and good to capture, but in our opinion it should come to an end or pause for now. In recent days, the market has now also shown first signs of significant weakness. In the big picture it was hardly worth mentioning, but still in relation to the movement since Corona one of the largest downward movements. This rally since spring 2020 was absolutely unusual - one should keep this in mind here once again. The market is still caught in its search for direction for now, but there are clear signs for further caution as well as for great opportunities in the market. Let's first look at the big picture using the S&P 500:
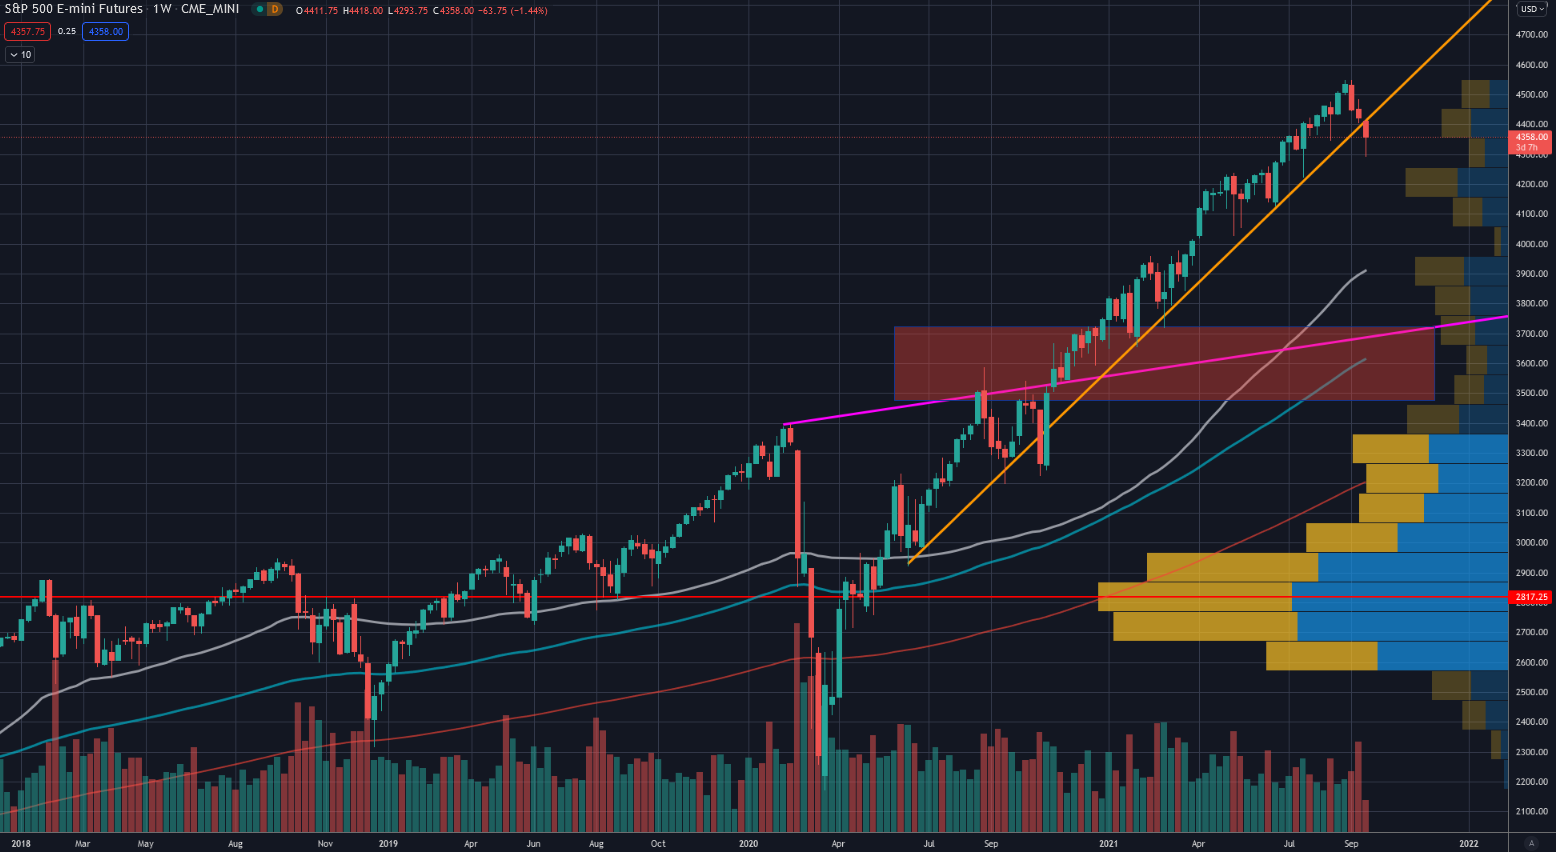
Depending on how one interprets the trend since Corona and draws the trend line, one can consider the trend broken as of yesterday. However, one does not have to and can also draw the trend more generously. If there is a significant pullback, we see the next really nice support only about 20% lower in the range of 3400 to 3700 points. What now speaks for and against a significant pullback.
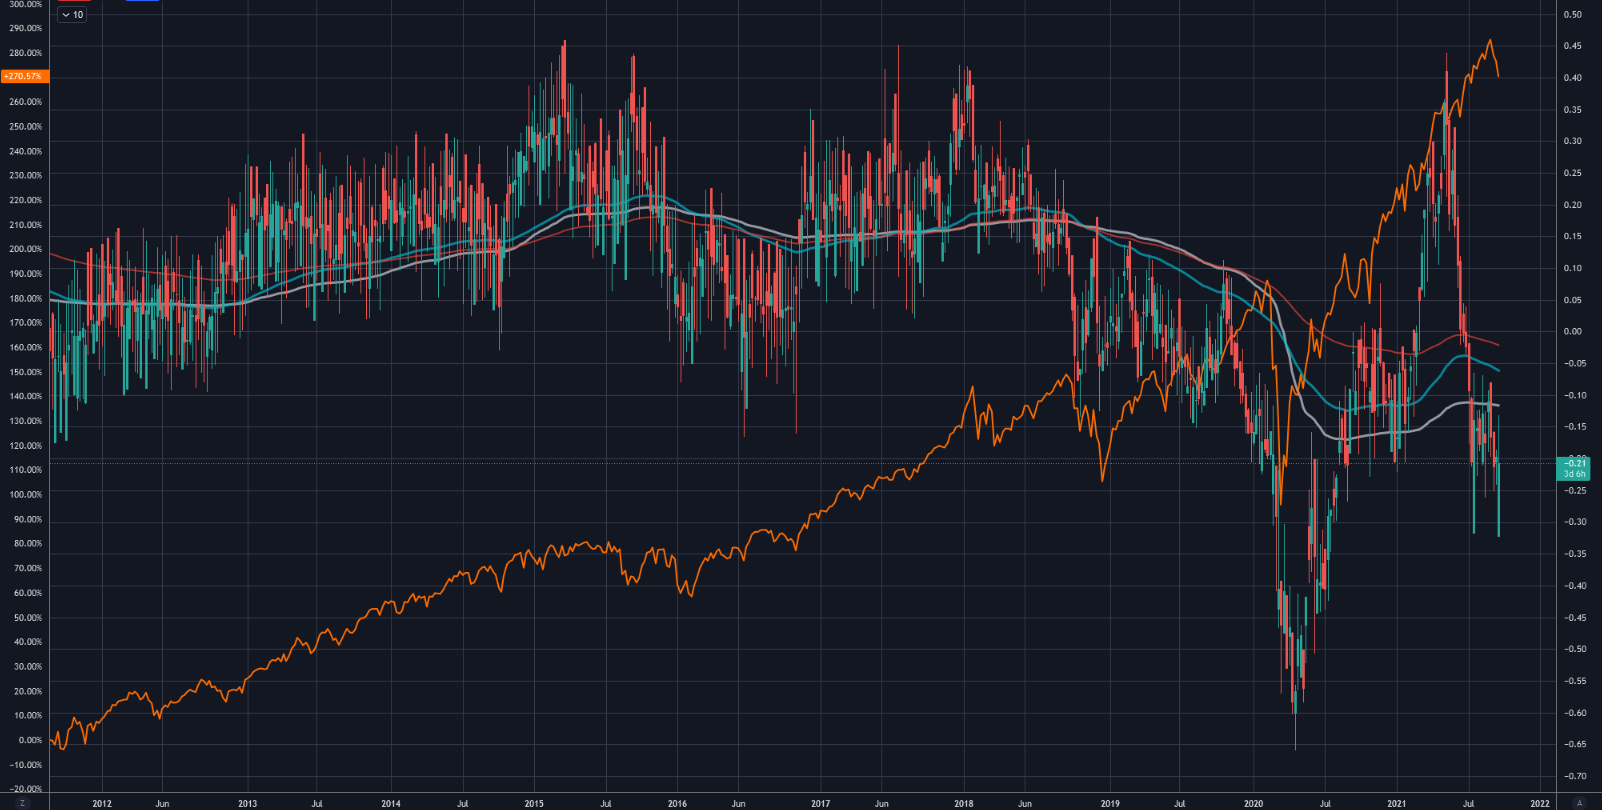
1. Rally: Market Breadth

This chart shows how many stocks are in an upward movement or downward movement (candles) as opposed to the S&P (orange). At the beginning of the year we saw a massive, market-wide upward movement that gradually weakened. Meanwhile, many stocks are already deep in a downward movement. The indicator has reached a depth at which smaller pullbacks found their end in the past. Exceptions were the large movements (2015/16, trade war 2018, Corona 2020).
2. Crash: Transport & Homebuilding
The transport and homebuilding sectors have proven to be early indicators for the overall market in the past. They can be used to read the activity of the economy and the investment appetite of the population. Since May, there has been a significant downward movement in these sectors relative to the market. In the past, such weakness was a good warning signal for unrest in the markets.
3. Rally: Robotics & AI
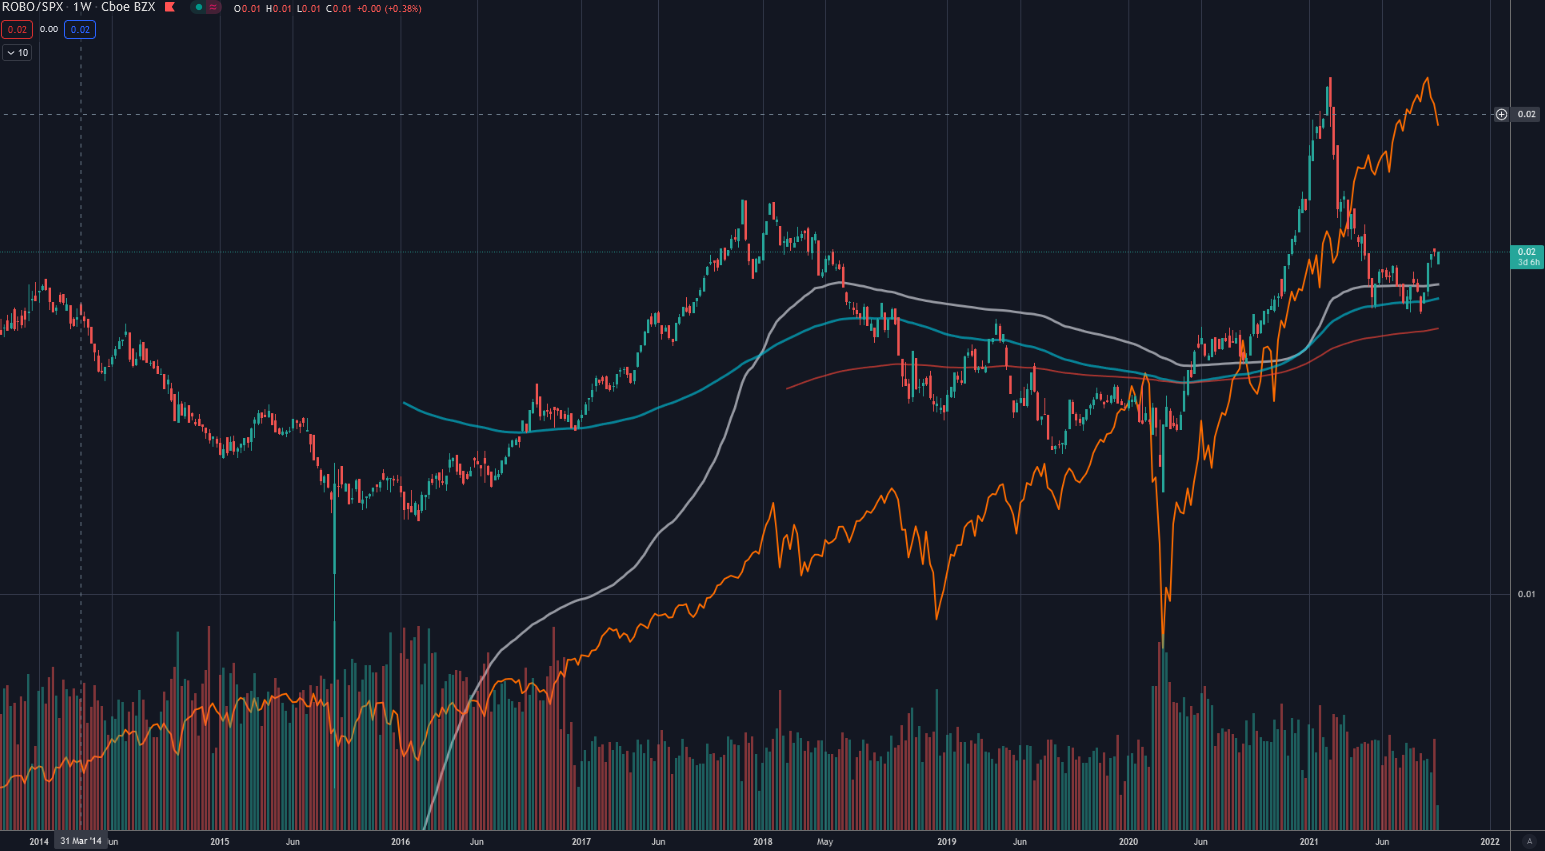
Another sector that works well as an early detection system is Robotics & AI. Business is going well in this area when production capacities are expanded, processes optimized, or investments are generally made by companies for the future. It is thus a good proxy for the caution or optimism of the economy. Here too we saw relative weakness since spring. However, this already seems to be over and the sector seems to be already switching to the next cycle of strength.
4. Crash: Economy
Ready for Better Investment Decisions?
Start your free trial today - stock analysis with artificial intelligence.
Full Transparency | Full Access | Cancel anytime
In the last article, the economic indicator was a reason for increased caution. Nothing has changed on this point and the discrepancy between reality and the stock market that has built up since May continues to exist.
5. Crash: Long-term Market Timing
In our market commentary for subscribers, we issued another clear warning last Thursday based on our market timing model. The long-term signals came increasingly, although not as clustered as, for example, in summer 2018. Above all, we saw no improvement in the slight downward movement - a warning signal.
6. Rally: Short-term Market Timing
By Monday, the situation had already changed significantly, at least from a short-term perspective. A buy signal in short-term market timing combined with a once again drastically fallen sentiment barometer prompted us to draw attention to new opportunities. Yesterday the market slipped significantly during the day, but was able to recover by the close of trading. Today we see the continuation of this recovery and on a short-term basis the opportunities remain good. The sentiment among retail investors is still extremely pessimistic, as we otherwise know it more from crash phases.
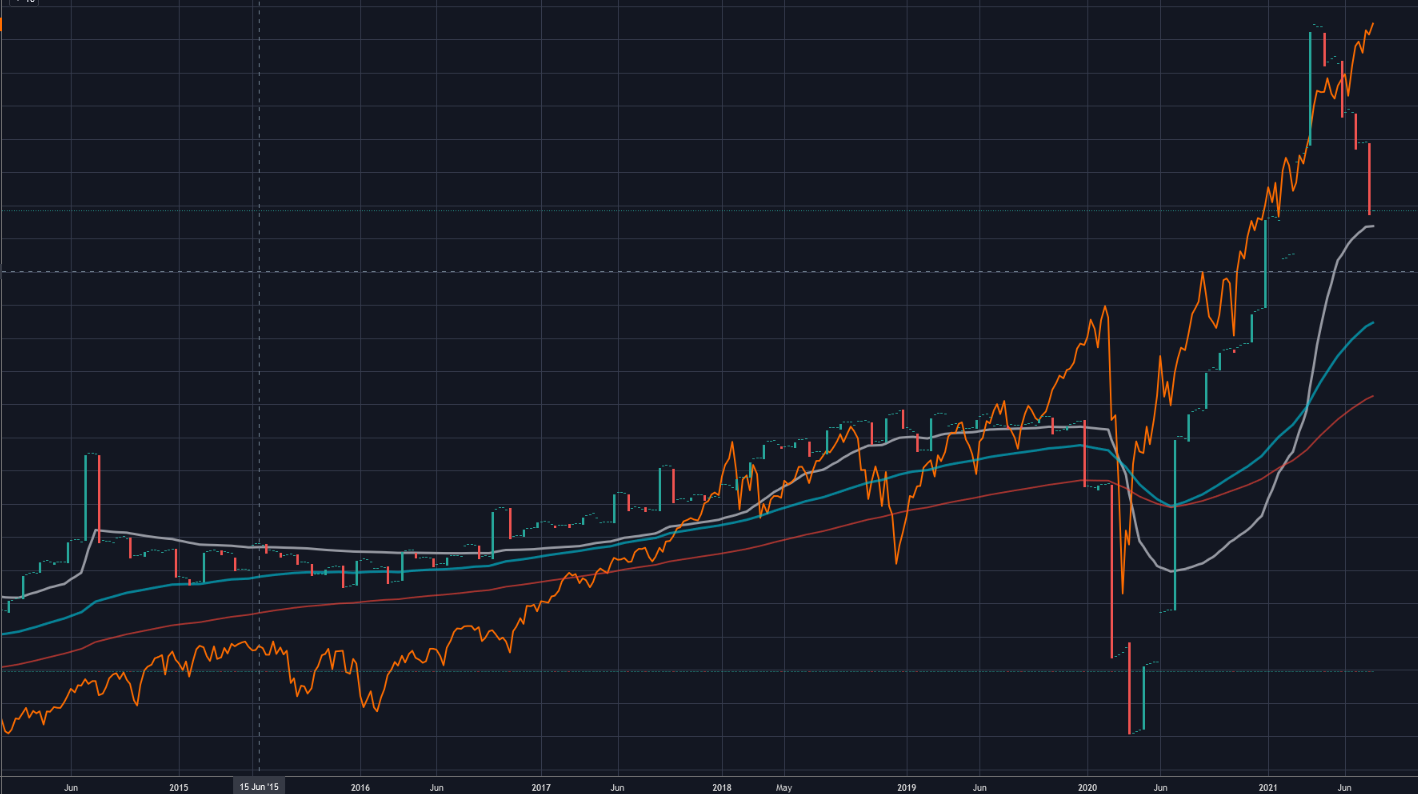
7. Critical Point: Money
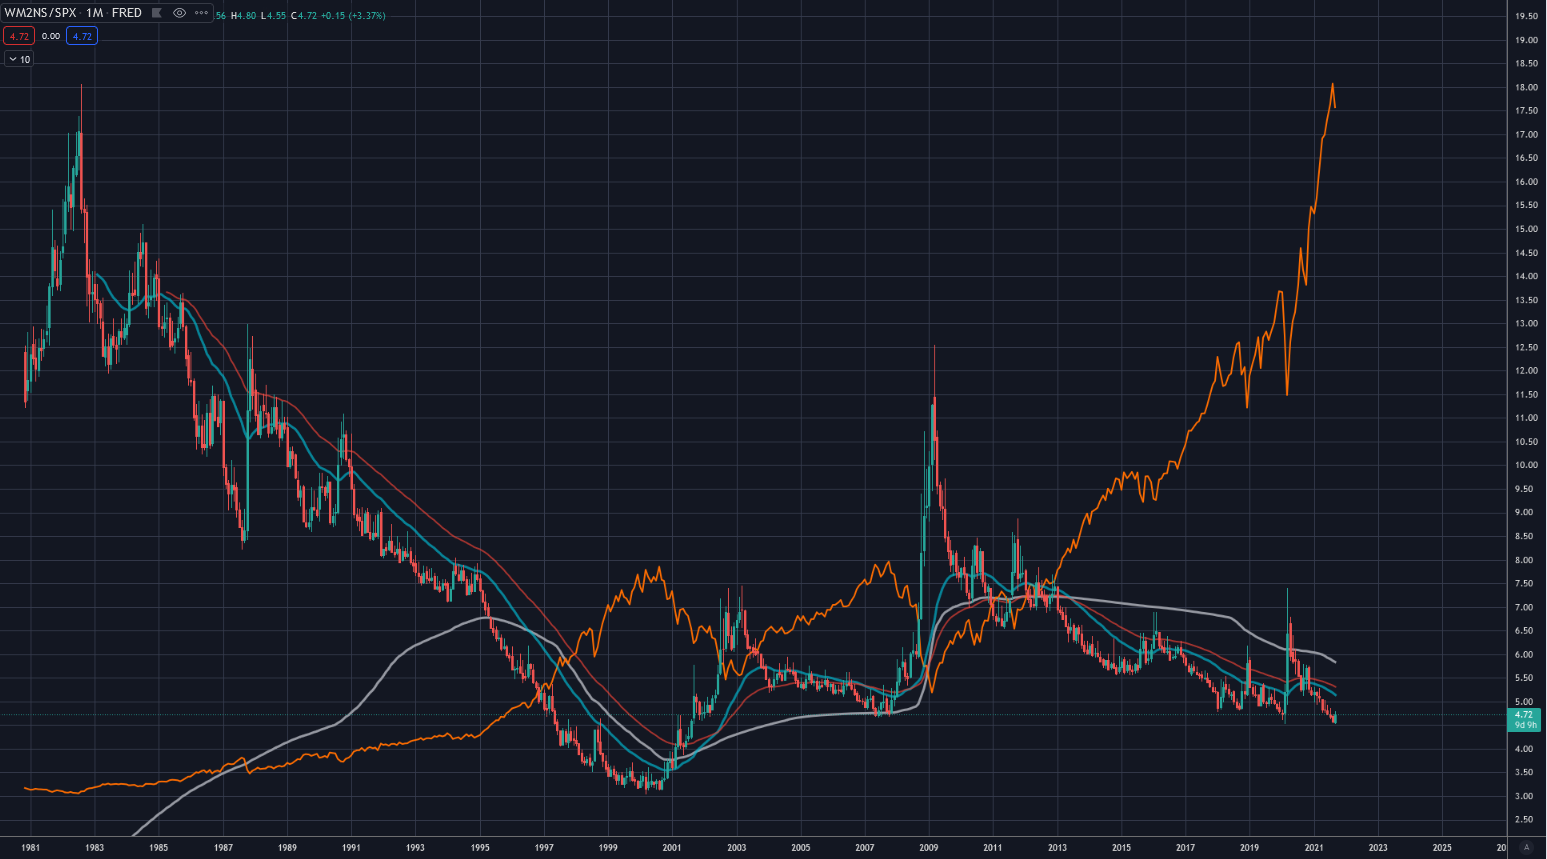
Last but not least, the very big picture: The S&P 500 versus the money supply in circulation. This chart shows how expensive the market really is. And in fact it is now exactly as expensive as directly before the Corona crash or also before the banking crisis of 2007. However, the dotcom bubble of 2000 lifted it to significantly more expensive regions.
What Now?
What happens now in the market, I cannot say. I see the warning signals, but the sentiment among retail investors is so bad that a sustained downward movement becomes difficult. Such persistent pessimism in the face of a strong market has never even come close to me to this extent. Here there is much potential for rising prices through new buyers whose pessimism capitulates due to rising prices. On the other hand, the rally has been extreme so far and deep cracks are showing in the market structure and from a macro perspective.
How to deal with this depends entirely on one's own style. I personally have built up some hedges against the case of a 20% pullback. For this I use a put spread on the S&P. This is only an option if one has access to real options. The spread rises to 15 times its purchase value should the market fall by 20%, and otherwise expires worthless. The simplest variant is always simply to hold more cash. In the short term, one can act tactically and in a controlled manner with a stop-loss against Monday's low.