We are living in truly interesting times. If you have only recently joined the stock market community, you should be aware of the unusual occurrences currently determining trading. Because, as already discussed in our previous articles, we are currently in a phase of (attempted) paradigm shift. In our annual outlook, we discussed the changes in market breadth – i.e., the proportion of companies that are driving the market upward. Now we are seeing, as already mentioned in the article on the German automotive industry, the expected dynamics in the area of value and growth investments.
What does value and growth investing mean? In short, exactly what the name suggests. Value investors search for values that the market has undervalued. In which there is more intrinsic value than the market is currently willing to pay. The core question of a value investor is: can the stock still fall deeply or are revenues, cash, and other assets already worth as much as one has to pay for the company. Growth investors, on the other hand, ask themselves: how far can the stock still rise. Revenues, reserves, and an assessment of the current situation are secondary. It's about the vision and growth potential. Tesla, Netflix, Facebook, right through to hydrogen and marijuana stocks are classic examples of growth values.
How does growth vs. value behave? Since pictures say more than a thousand words, let's compare two classic examples of growth and value stocks: Amazon and Deutsche Telekom.
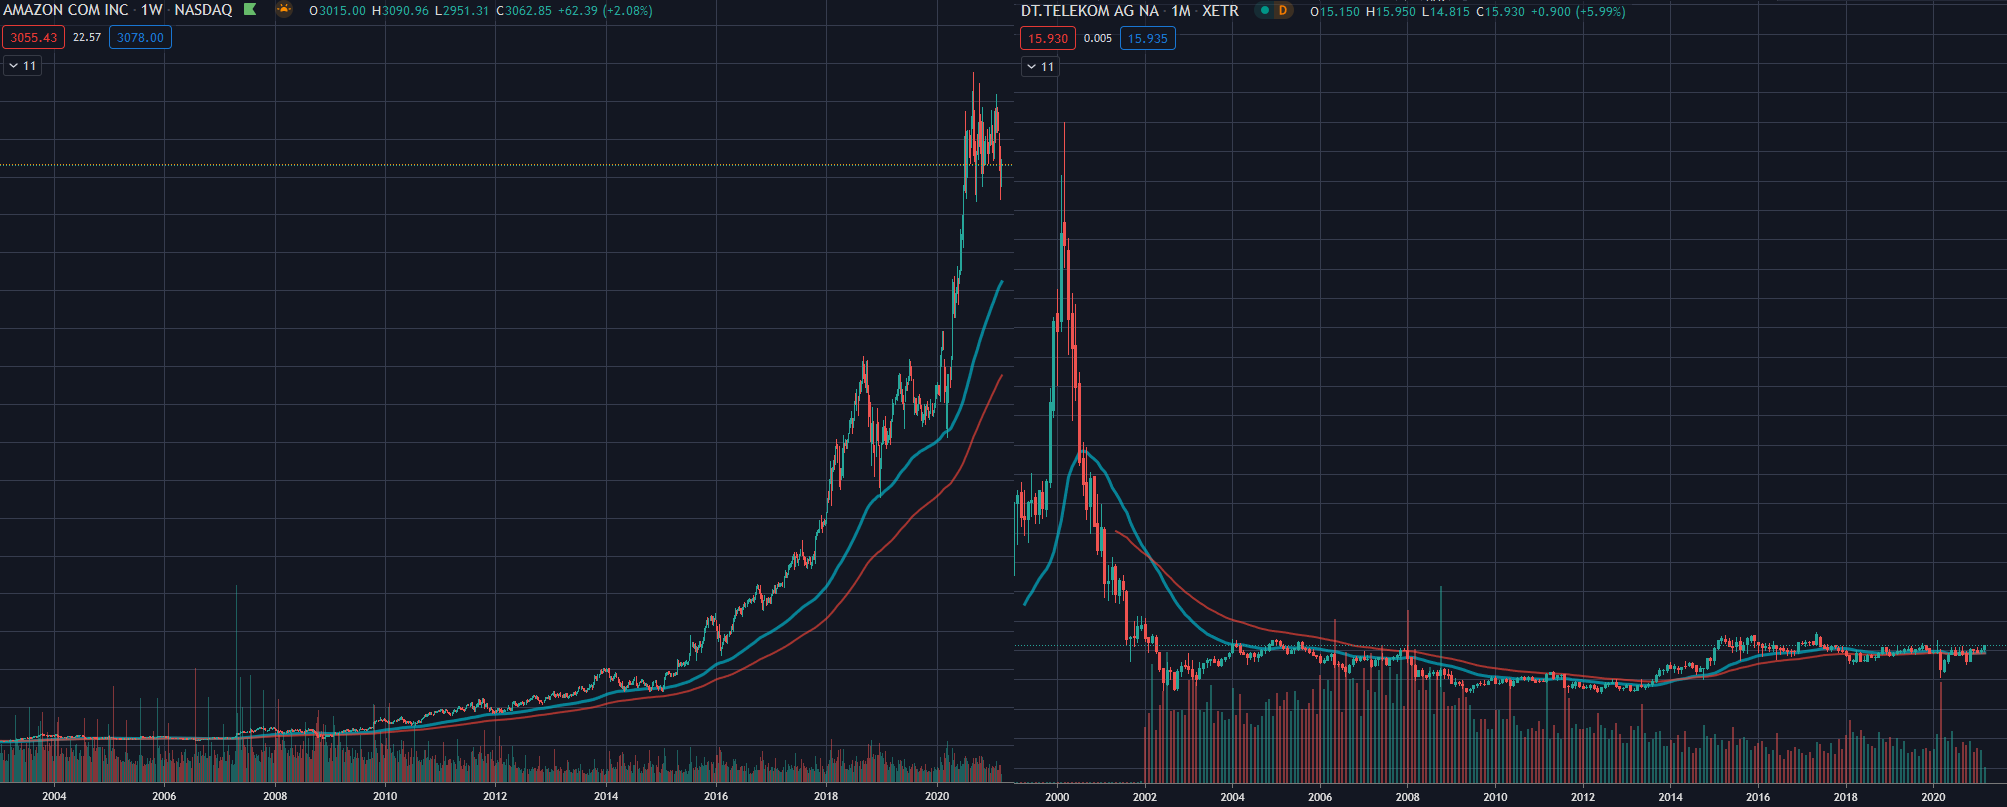
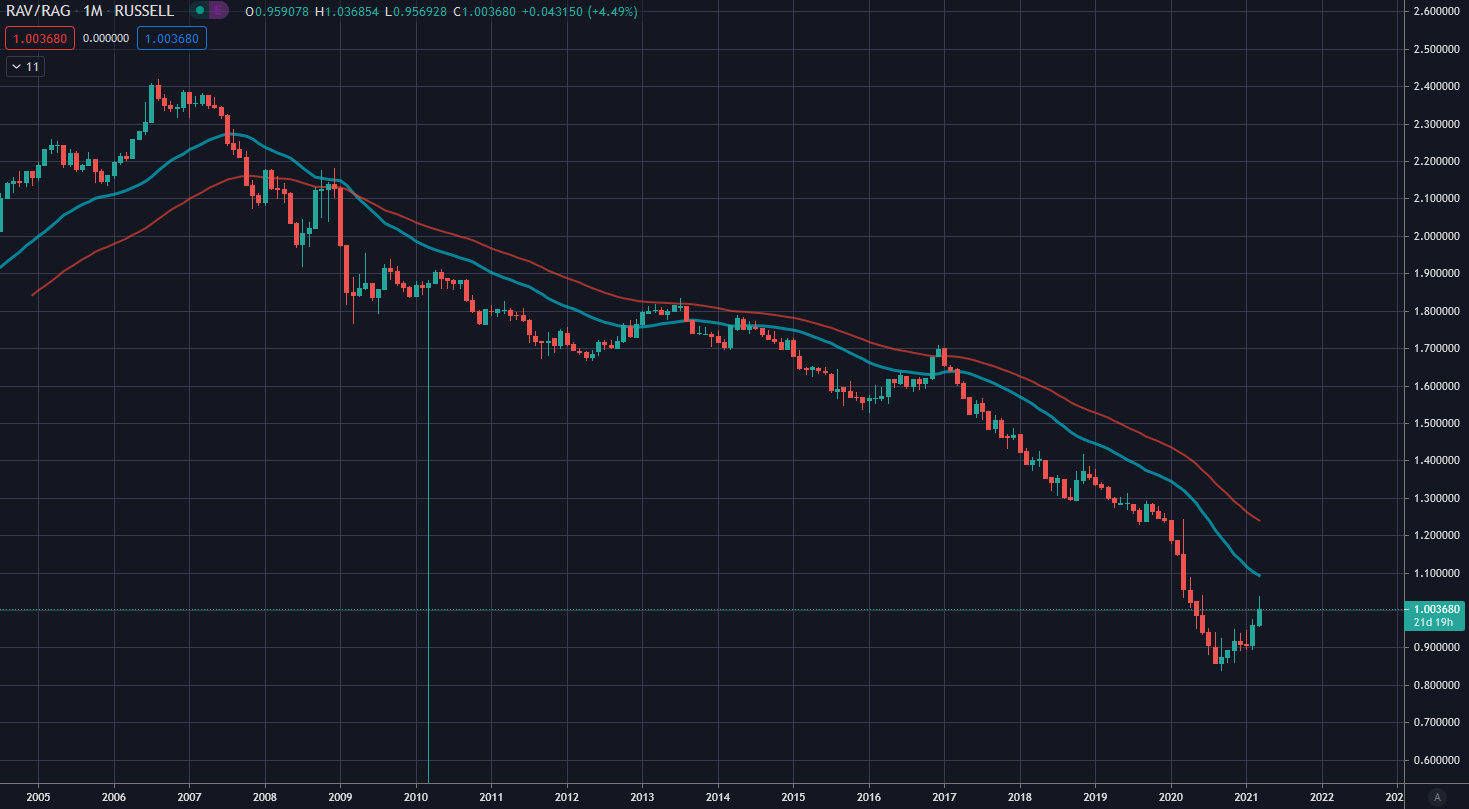
While Amazon's value has increased a hundredfold over the last 20 years, Telekom hasn't gotten off the ground and only moved briefly during the tech bubble of 2000 before immediately crashing spectacularly again. Not quite as bad, but still similar to Telekom, value portfolios have behaved for many years. For around 15 years, the value ratio of value vs. growth stocks has only known one direction: downward. A good visualization of this stock market regime are the Russell 3000 Growth (RAG) and Value indices (RAV):
Ready for Better Investment Decisions?
Start your free trial today - stock analysis with artificial intelligence.
Full Transparency | Full Access | Cancel anytime
Russell Value in relation to Russell Growth: Downward for decades
What happens next? The underperformance of value stocks had accelerated once more after the Corona crash until September. Since then, a base formation began, as we also identified in our article on the German automotive industry almost three weeks ago. In the last two weeks, we have now been able to observe the dynamic upward movement of value. US tech in particular was hit hard by this shift to value.
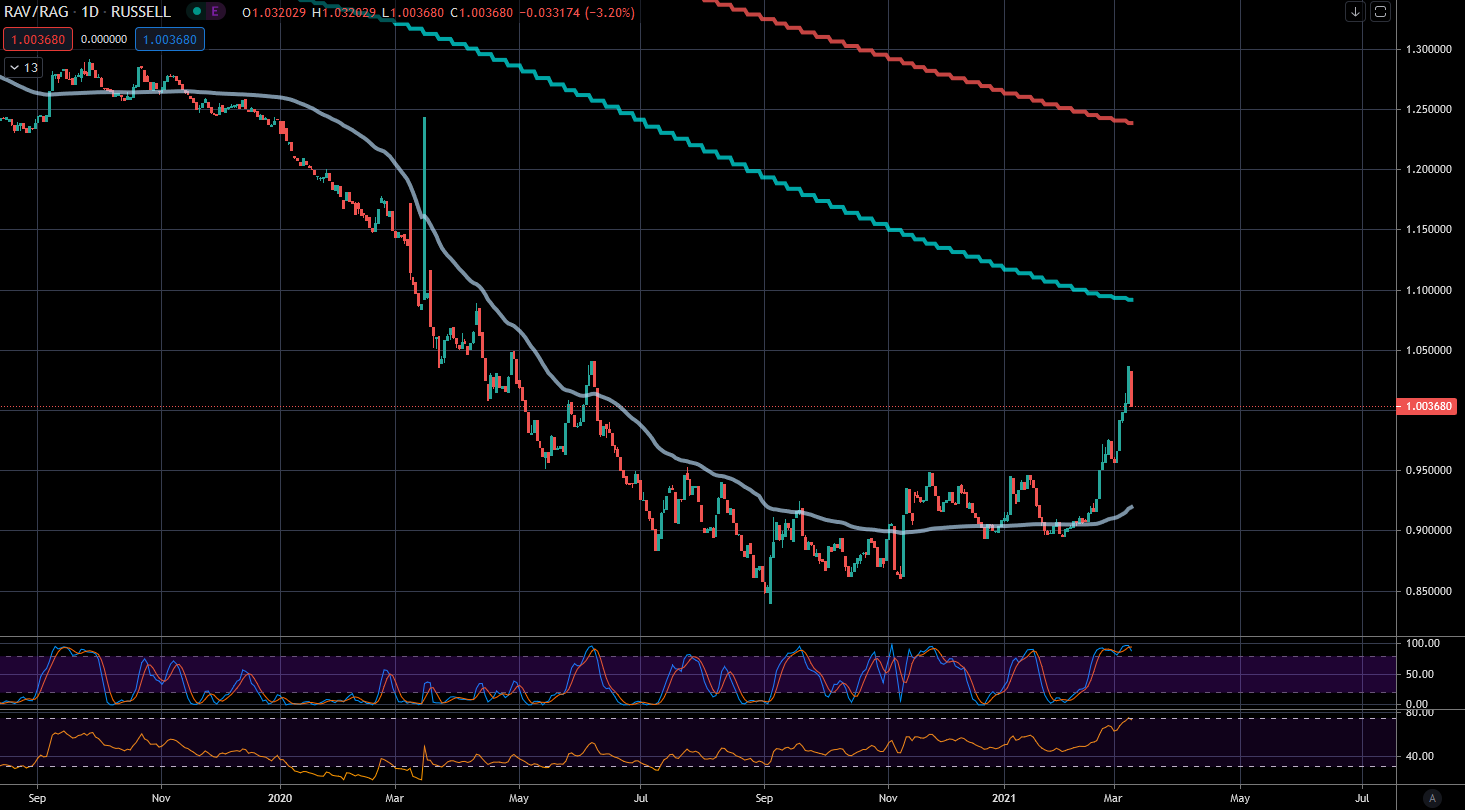
The expected value rally
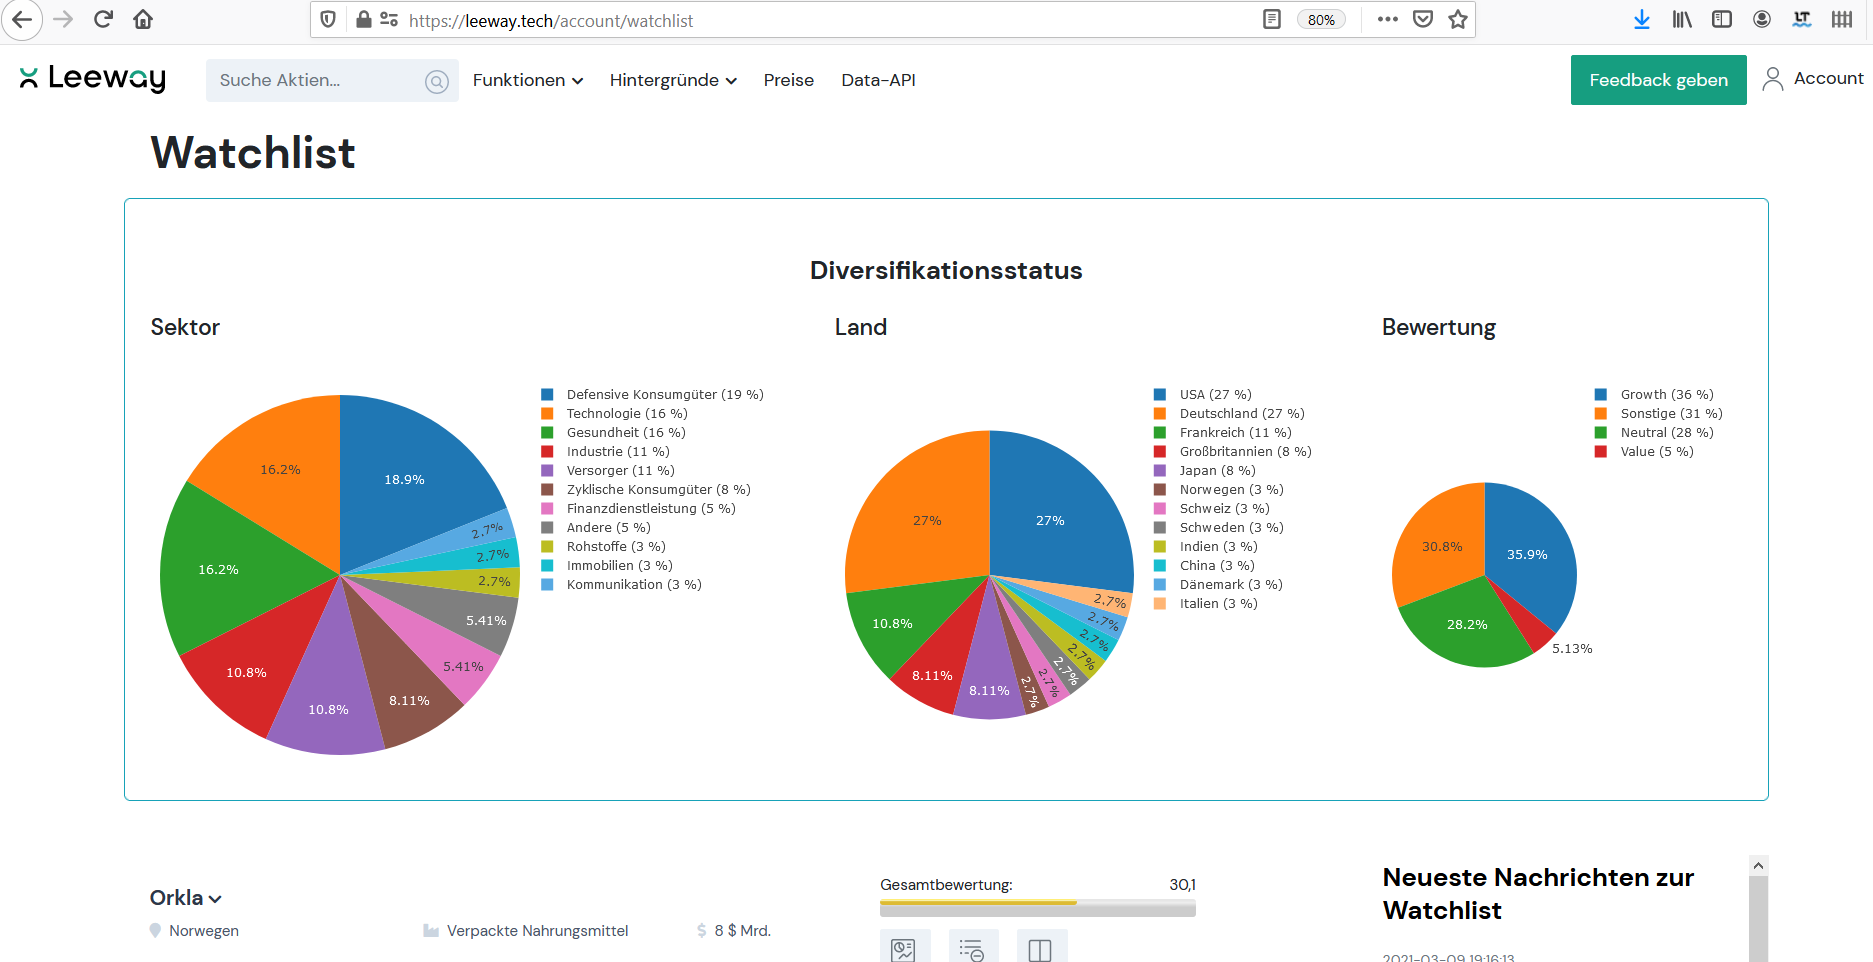
This movement has now run quite far and could well use a pause. We are still far from being able to speak of a trend reversal. For that, at least the turquoise, better still the red moving average would have to be overcome. That's where the last reversal attempts of 2013 and 2017 failed. However, it is the strongest attempt since the beginning of the growth festival of 2007 to switch to a value regime. A good time to diversify the portfolio in this respect as well and to include growth vs. value weighting alongside sector and country weighting.
Ready for Better Investment Decisions?
Start your free trial today - stock analysis with artificial intelligence.
Full Transparency | Full Access | Cancel anytime
I also had to realize that value is heavily underweighted in my portfolio.
I will now take a closer look at some of our highest-ranked value stocks, such as Telekom, Fresenius, or Deutsche Post. But here too, I must pay attention to diversification and not only look for value stocks in Germany. In the USA, there are some interesting values, for example, the collection of the king of value investors Warren Buffett with Berkshire Hathaway. But you can also quickly find them in Sweden or England.
Lars Wißler owns shares of Amazon, Deutsche Telekom, and Fresenius. PWP Leeway does not own any of the mentioned stocks.
