Interest rate turnaround, uncontrollable inflation, invasion by Russia and the repeatedly emerging thought of a conflict with NATO. The start of 2022 was certainly one of the more difficult ones in history. In fact, the first 50 days of the year were the fifth-worst since 1927 in the S&P 500.
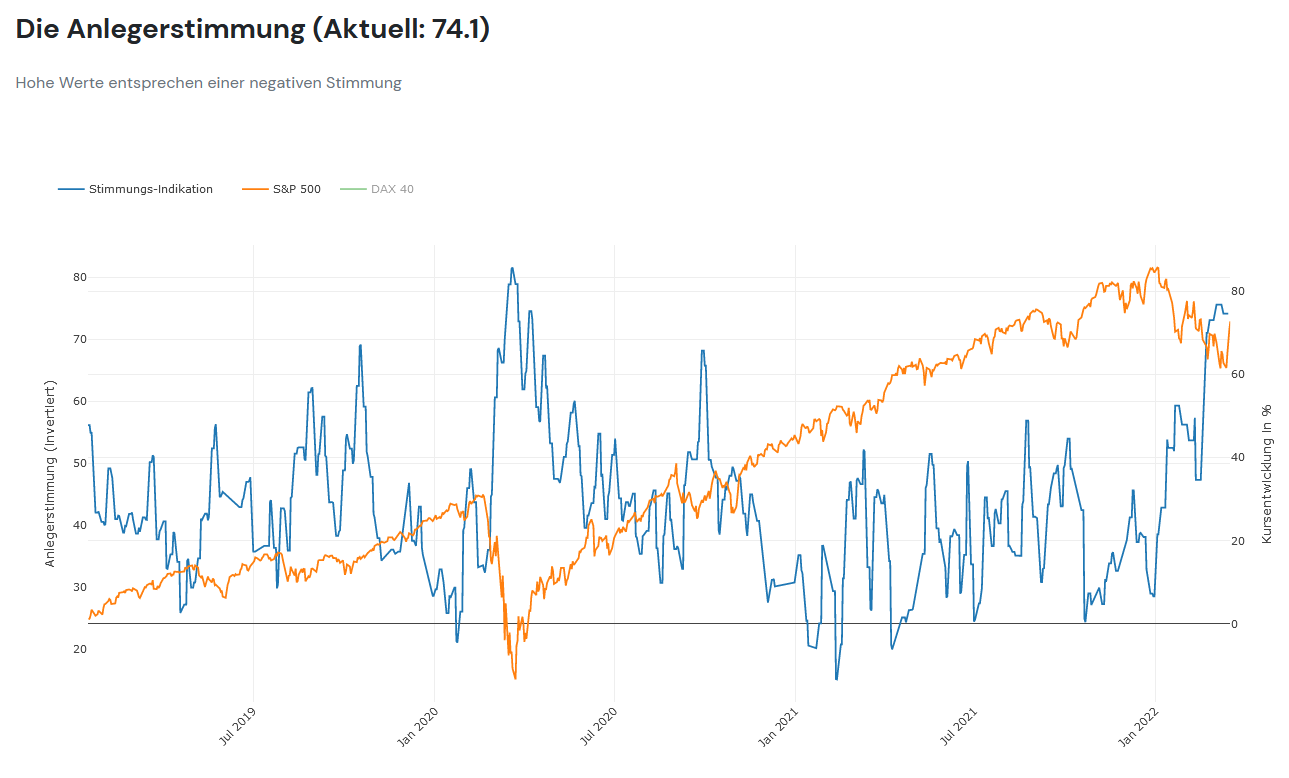
Now we have gotten used to quite a bit through 2020 and compared to the Corona crash, the last months were very harmless. Nevertheless, even though the markets have only fallen 15% to 25%: the sentiment of investors has left significantly deeper marks during this time than the price losses would suggest. The new Leeway Sentiment Indication shows it clearly:
Ready for Better Investment Decisions?
Start your free trial today - stock analysis with artificial intelligence.
Full Transparency | Full Access | Cancel anytime
Sentiment was more negative only once in the last three years - at the height of the Corona crash in March 2020. Such negative sentiment levels were followed with high probability by a strong upward movement in the stock markets. This also fits with the history of the worst starts to the year. When the year began as weakly as this one, double-digit gains regularly followed, with the exception of 2008.
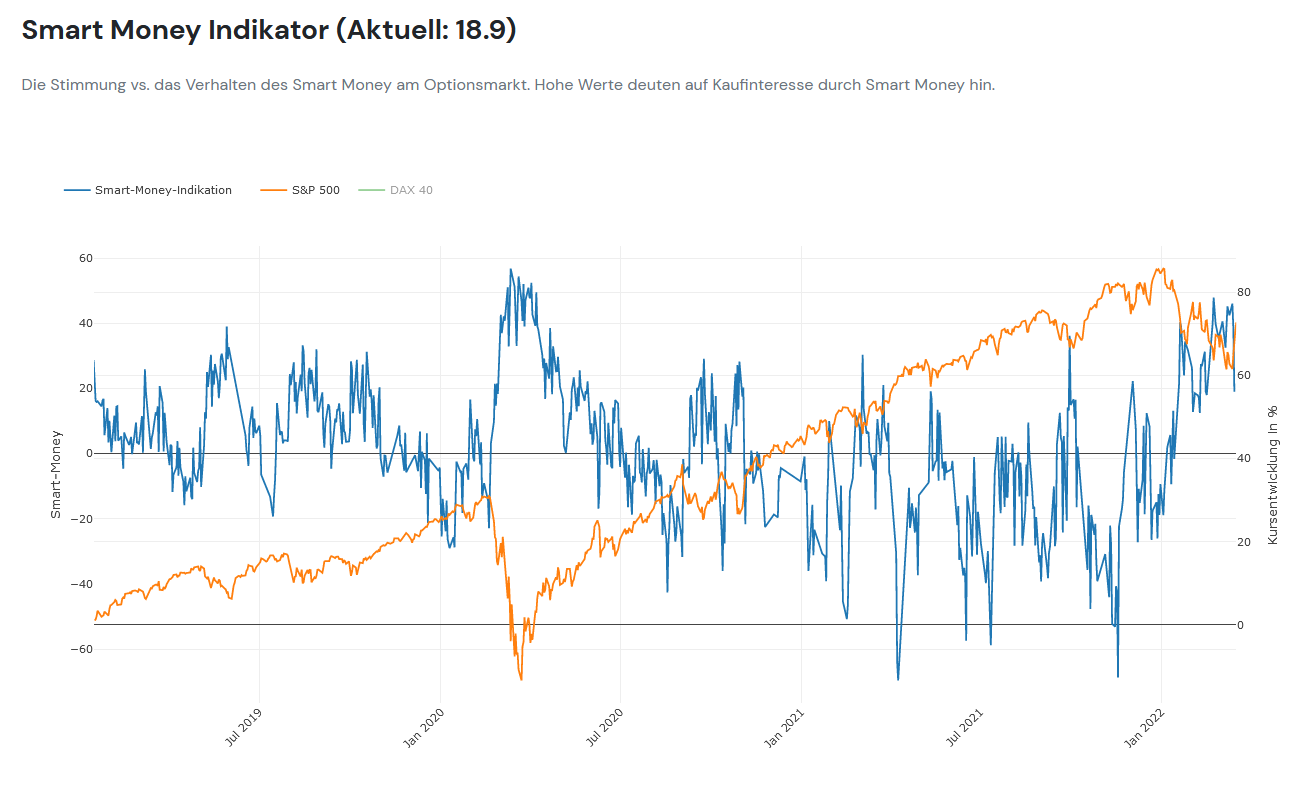
The Smart Money Indicator, which puts the actions in the options market in relation to investor sentiment, was also able to advance into similar regions as during the 2020 crash:
Ready for Better Investment Decisions?
Start your free trial today - stock analysis with artificial intelligence.
Full Transparency | Full Access | Cancel anytime
This indicator reacts somewhat more dynamically than the pure sentiment indicator and already indicated optimal buying regions on February 24. Since then, we have been in a downward exaggeration phase, triggered by the panic in the European markets. With the break of the downward trend, this exaggeration has technically ended.
Much of this points to an excellent buying opportunity. Due to the extremely pessimistic sentiment, there is currently a lot of money on the sidelines that has problems keeping up with the performance when prices rise. The classic Fear of missing out (FOMO) effect, which then further fuels a beginning rally.
