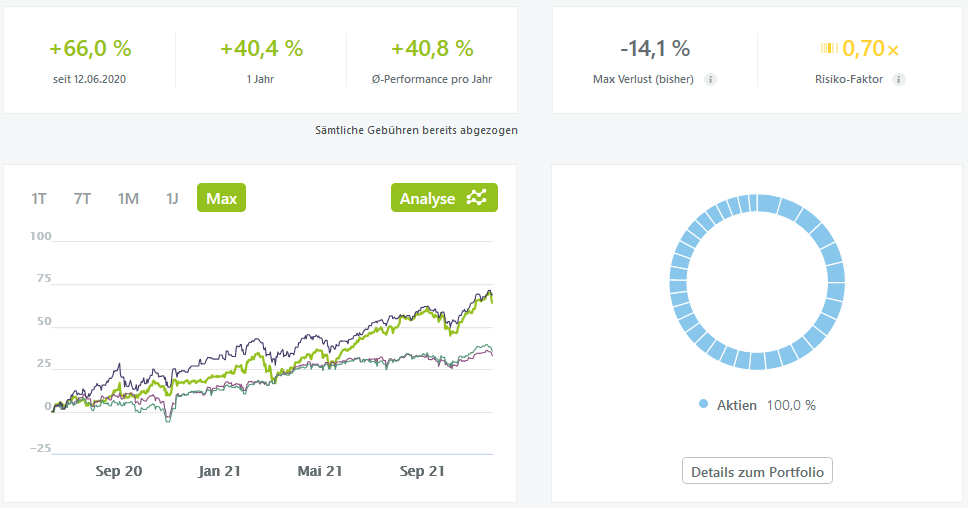
In our Wikifolio Leeway AI - Quantitativ Global we would like to demonstrate the power of our analysis. To do this, we implement fundamental analysis in a portfolio that is as simple and diversified as possible. The best-rated stocks from the rankings are purchased without further thought - provided the concentration of a country or sector is not already too extreme in the portfolio.
Over the last 15 months, the portfolio has kept pace with the NASDAQ 100 even after fees of 8 to 9%, and has left the DAX, EURO STOXX and MSCI World far behind with an outperformance of around 30%.
However, the selection made by our algorithm apparently has another interesting side effect apart from the strong performance. We have frequently observed that the movement of the Wikifolio preceded the movement of the market in situations of directional change. At noon on November 10th, I wrote in the chat: "The Wikifolios are losing again. So far, they have been a reliable early indicator for the market". After the opening of the stock exchange in the USA, prices then fell in one go by ~1%. We have been able to identify this pattern quite frequently.
It therefore appears that the algorithm selects the "Market Leaders", the early adopters of trend movements who are the first to move in a new direction and are therefore 1-2 days ahead of the overall market. Today we are once again seeing broad outperformance in the Wikifolios in contrast to the indices. Signs of a beginning rally?
For months we have been talking about finding direction in the markets. For a few weeks now we have been seeing the end of this phase and the time for decision. The time has now come. The market is breaking out in all directions, but so far not sustainably and without decision. The indices appear very vulnerable.
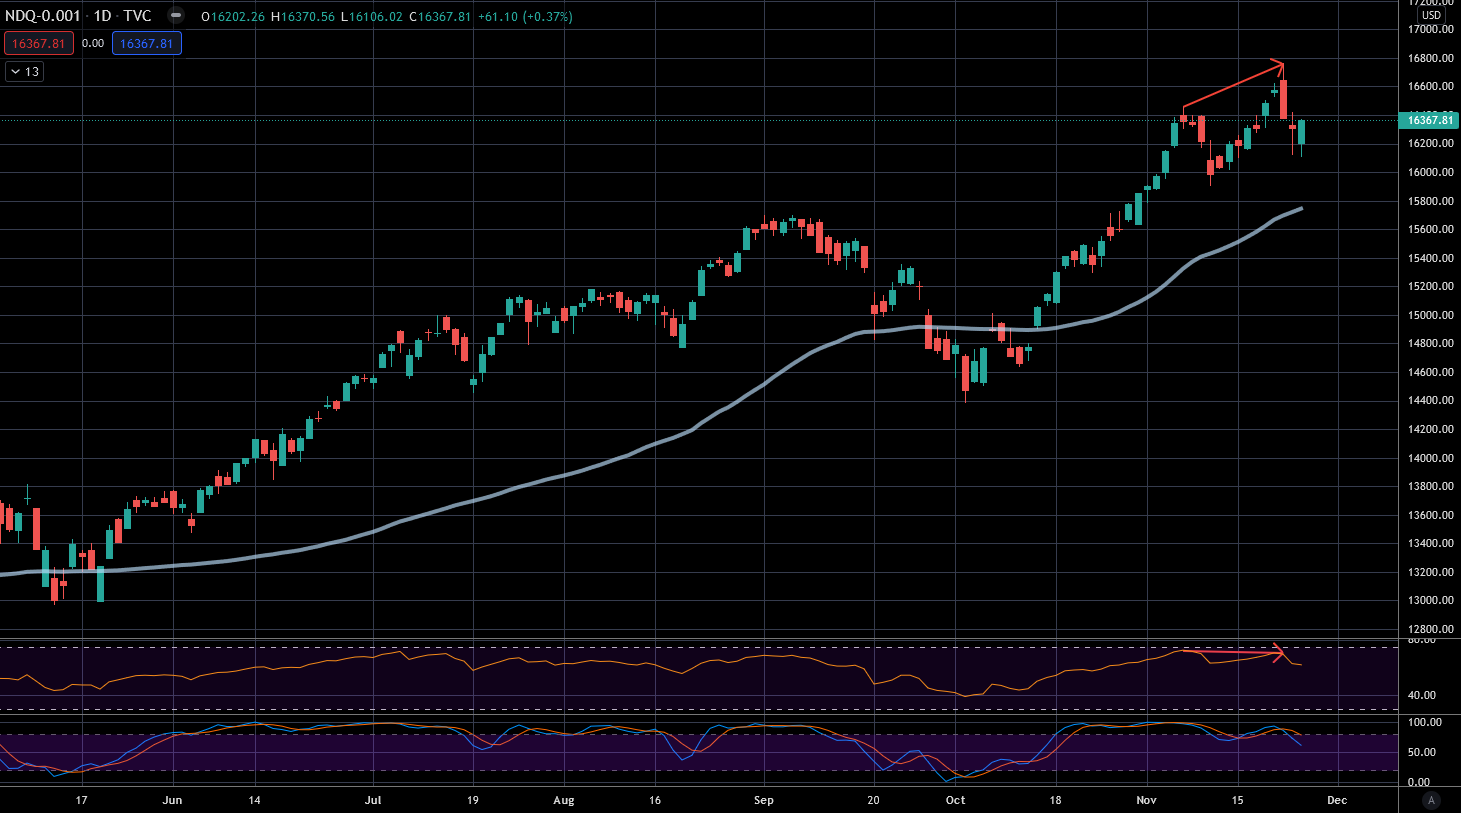
The NASDAQ in particular shows a really frightening divergence in the RSI, with the higher high in prices and the lower one in the RSI, which strongly indicates a market top. Should this formation actually run its course, the stock markets would certainly tackle double-digit declines. However, I consider it more likely that this formation is a deception. Let's look at the VIX again.
Ready for Better Investment Decisions?
Start your free trial today - stock analysis with artificial intelligence.
Full Transparency | Full Access | Cancel anytime
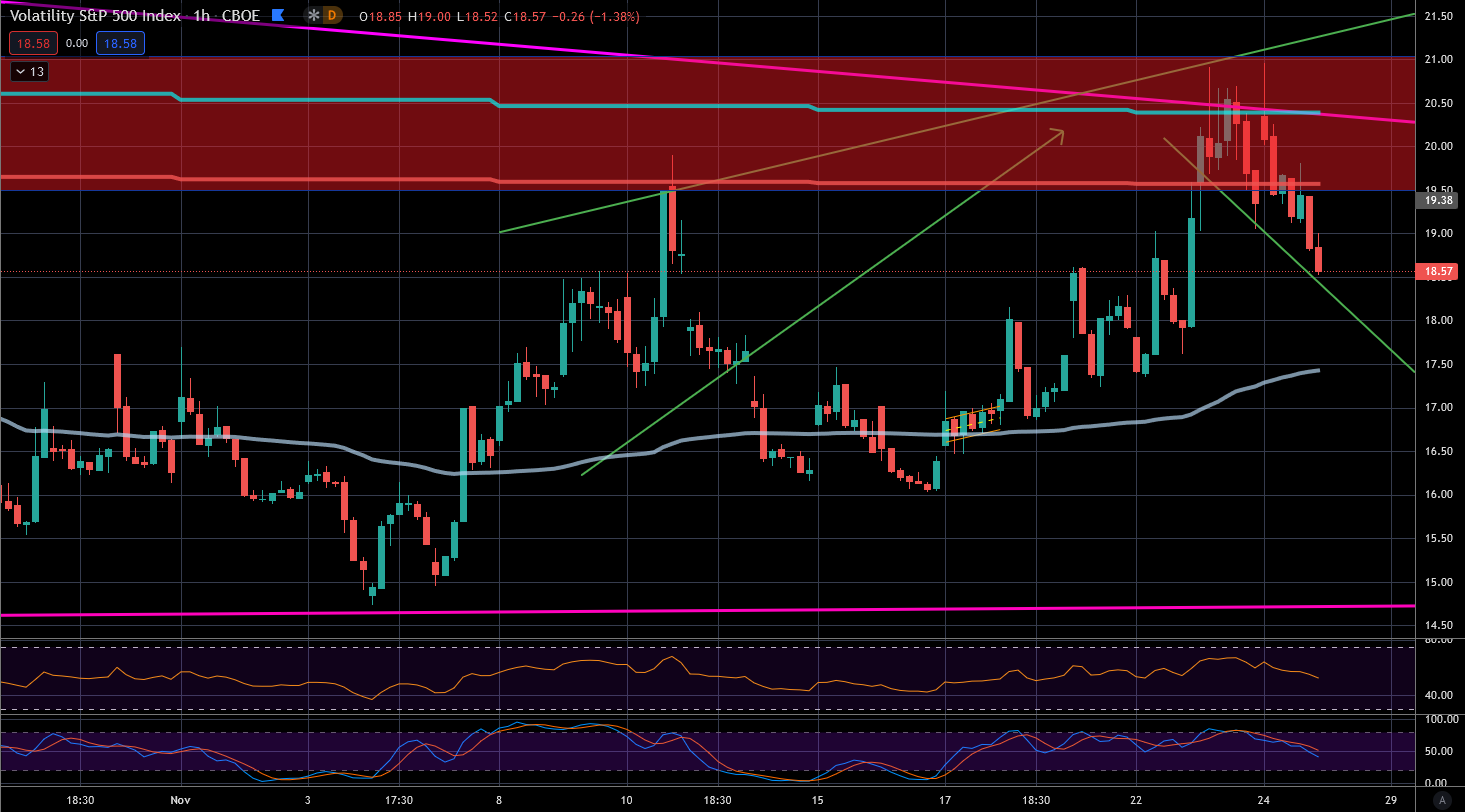
The essential resistance zone between 19.50 and 21 points has now held three times in November. The last two attempts from yesterday and the day before yesterday were rejected with emphasis. As long as this zone holds, the bull market is not in danger. The Russell 1000, the US Small Cap Index, also shows a very different picture than the NASDAQ.
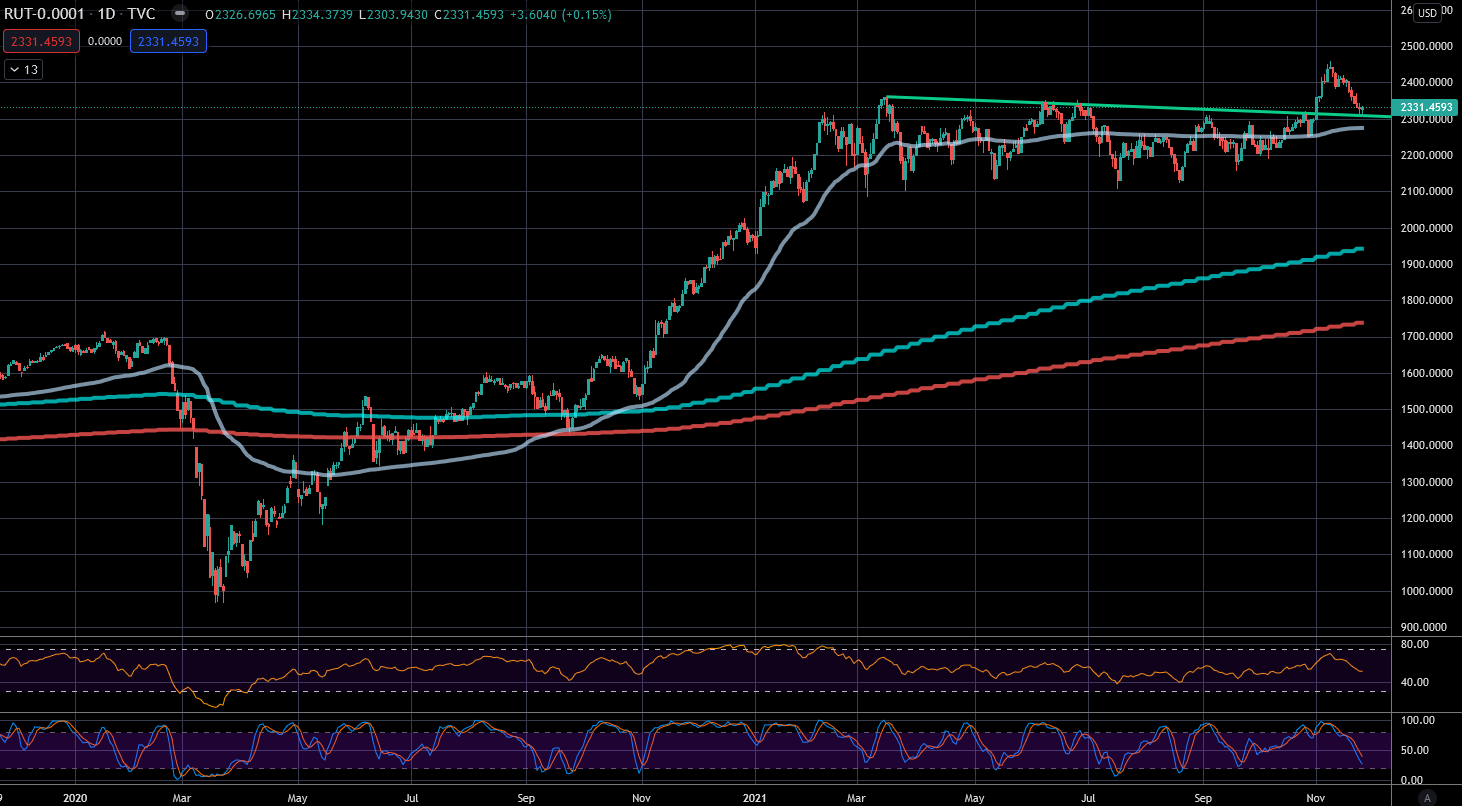
Here the index has completed a wonderful consolidation and is currently sitting on the retest line after the price broke out of the sideways movement since February. We already discussed this situation at the beginning of November. So if the strength in the Wikifolio once again proves to be an early indicator, the dangerous situation in the NASDAQ and the S&P would be averted and instead we would have a brief consolidation in an upward-moving channel that resolves to the upside. One of the strongest continuation formations in rallies that exists.
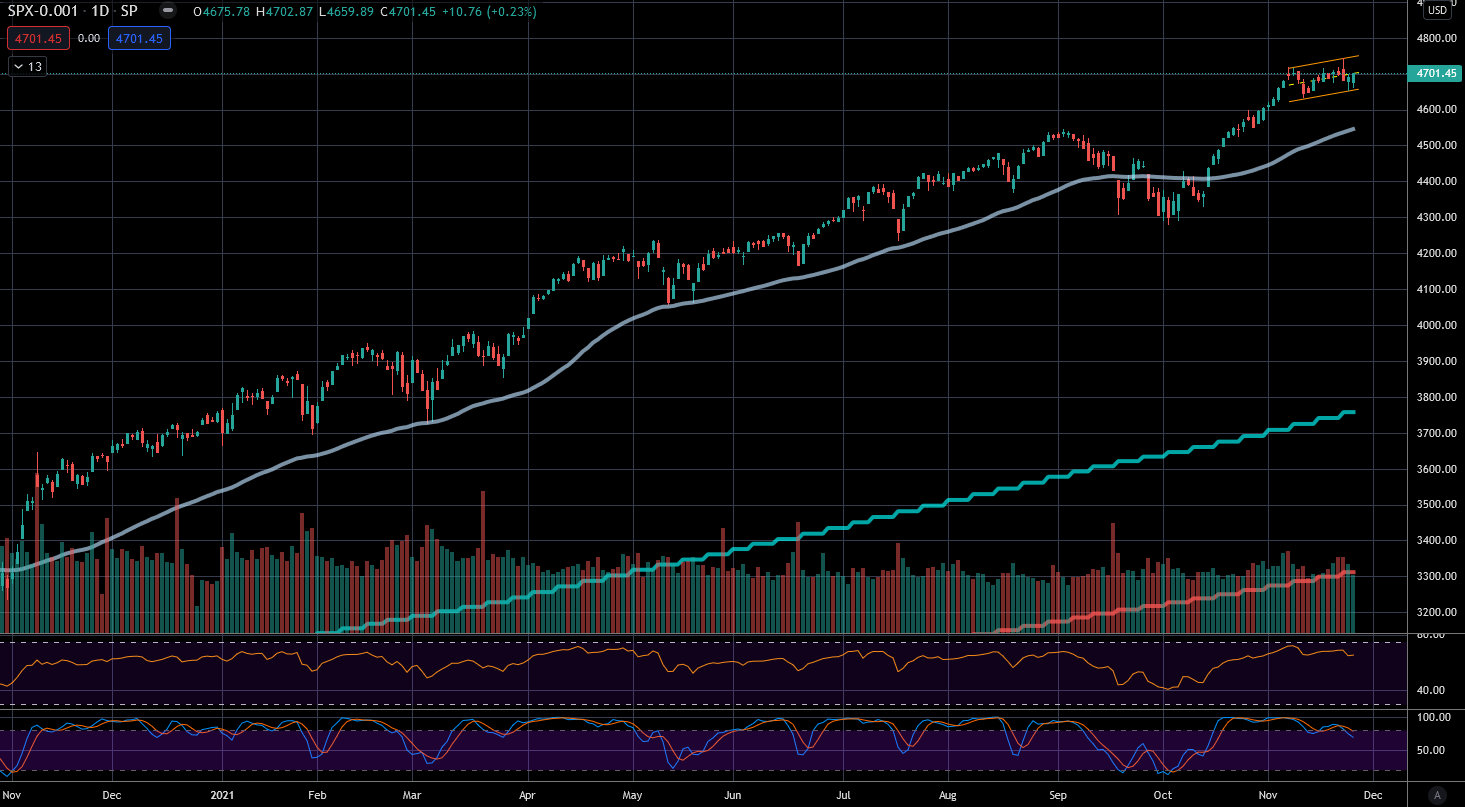
So there is much to suggest that now is the optimal time to buy stocks that we have been waiting for about three months. Unfortunately, the retest in the S&P and NASDAQ has not occurred, as was the case in the Russell. Good entry points are always characterized by the fact that the margin is small. This way you know quickly whether the situation is different after all, and you can exit the market again with a small loss. This is also the case here. If the VIX does not rise and if the indices run upwards again here, then everything is in order. If not, you simply have to get out again. This becomes apparent very quickly and is correspondingly favorable.