For more than a year, hardly any other topic has been discussed: Everything revolves around health. However, this is not reflected on the stock exchange. On the contrary: The shares of the large pharmaceutical companies are not among the winners of the Corona pandemic. The shares of Roche and Novartis generally behave rather leisurely. No rapid upswings, rather slight sideways to upward movements. If you include the dividend of around 3%, the price gains over the last decades are not bad. However, in the pandemic environment, they tend to be among the weaker part of the market. The chart pattern of both stocks looks very similar with a slight advantage for Roche.
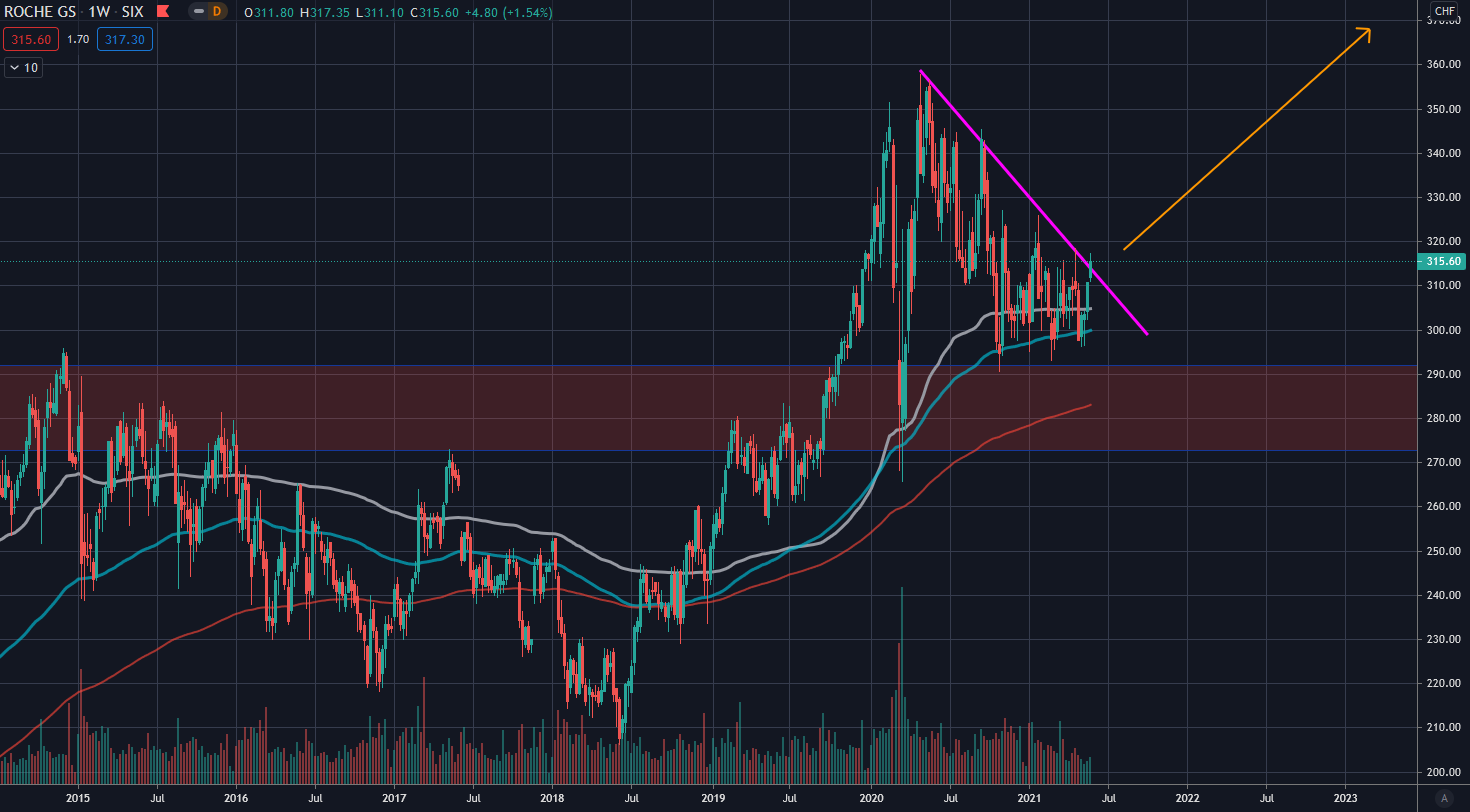
Roche weekly candles
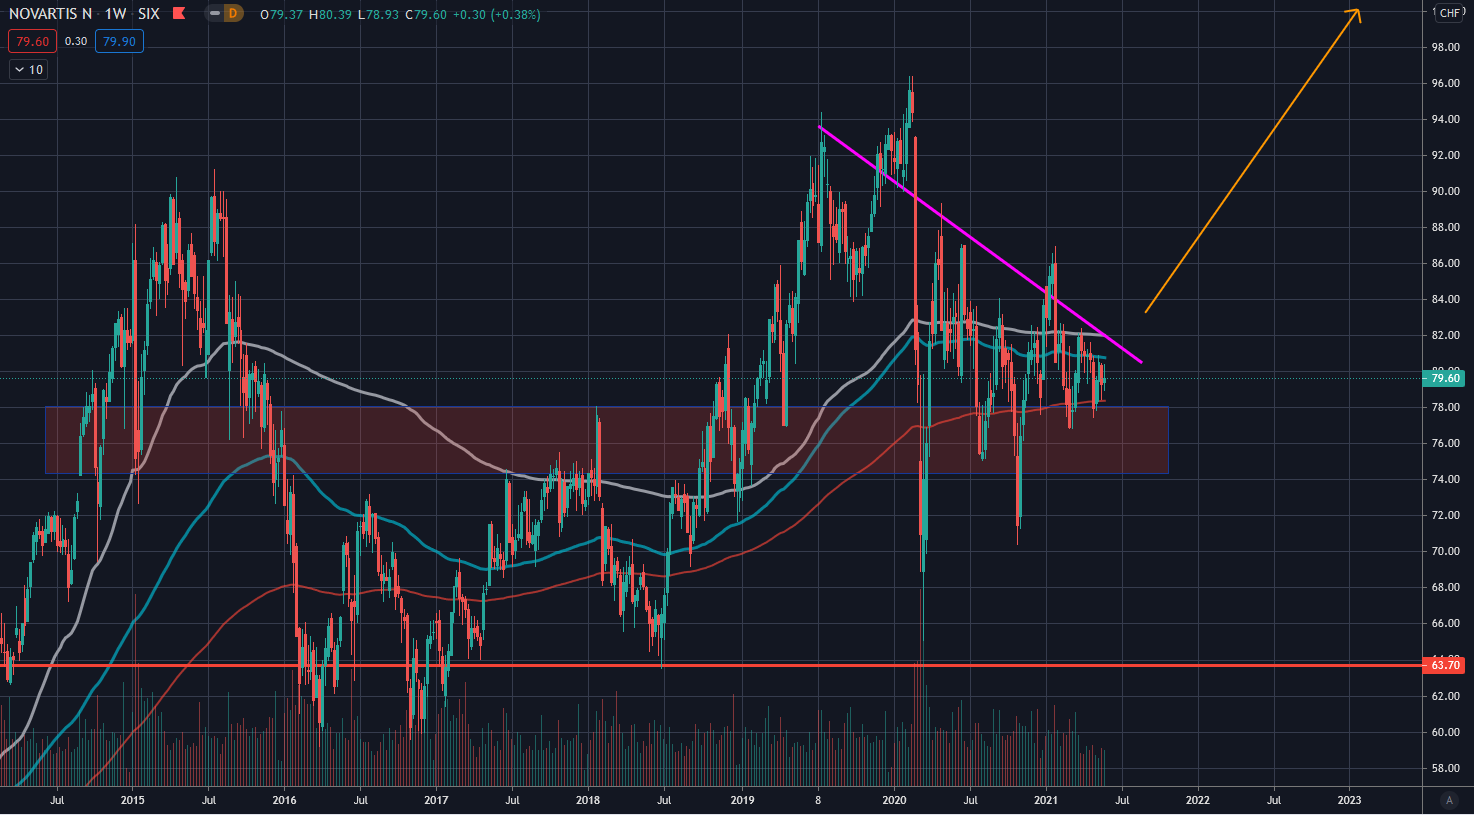
Novartis weekly candles
Both Roche and Novartis have been moving for a year in a narrowing trading range between long-term support area and one-year downtrend. Roche is currently showing signs of breaking through the downtrend. Novartis is still holding back in comparison. However, both chart patterns indicate the build-up of trading pressure and a dynamization of the movement cannot be long in coming.
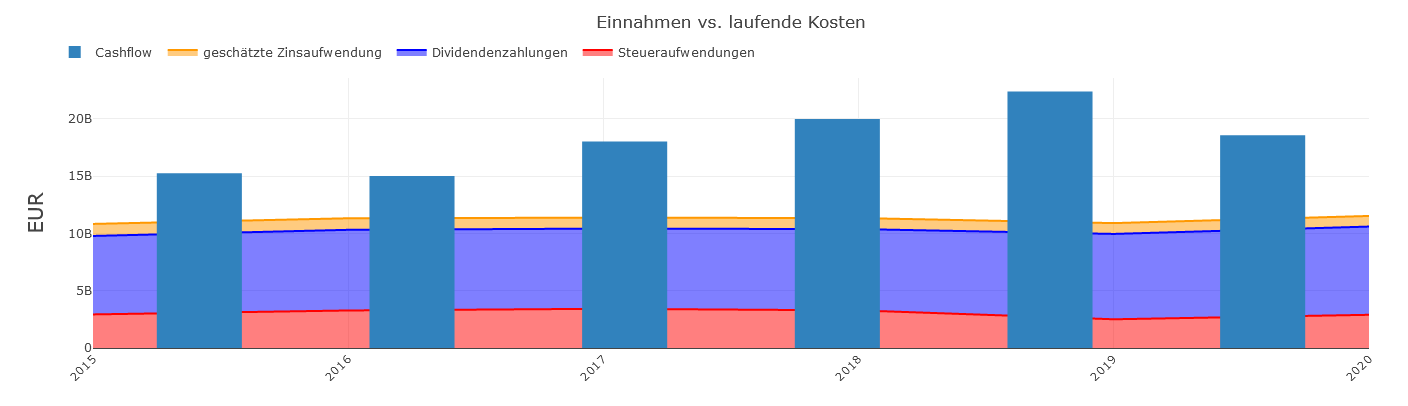
Graphical Balance Sheet: Roche
Fundamentally, a very consistent business is characteristic for both companies. Here in the example cashflow vs. expenses of Roche. Over years, debts, dividend and tax expenses have remained practically unchanged with minimal fluctuations in cashflow. The same picture emerges for Novartis, except that the cashflow is even more stable. Such stability in business is reassuring and also explains the calm to boring price performance. Surprises are rare and the future is very predictable, making the decision for institutional investors as to whether the investment is worthwhile correspondingly simple.
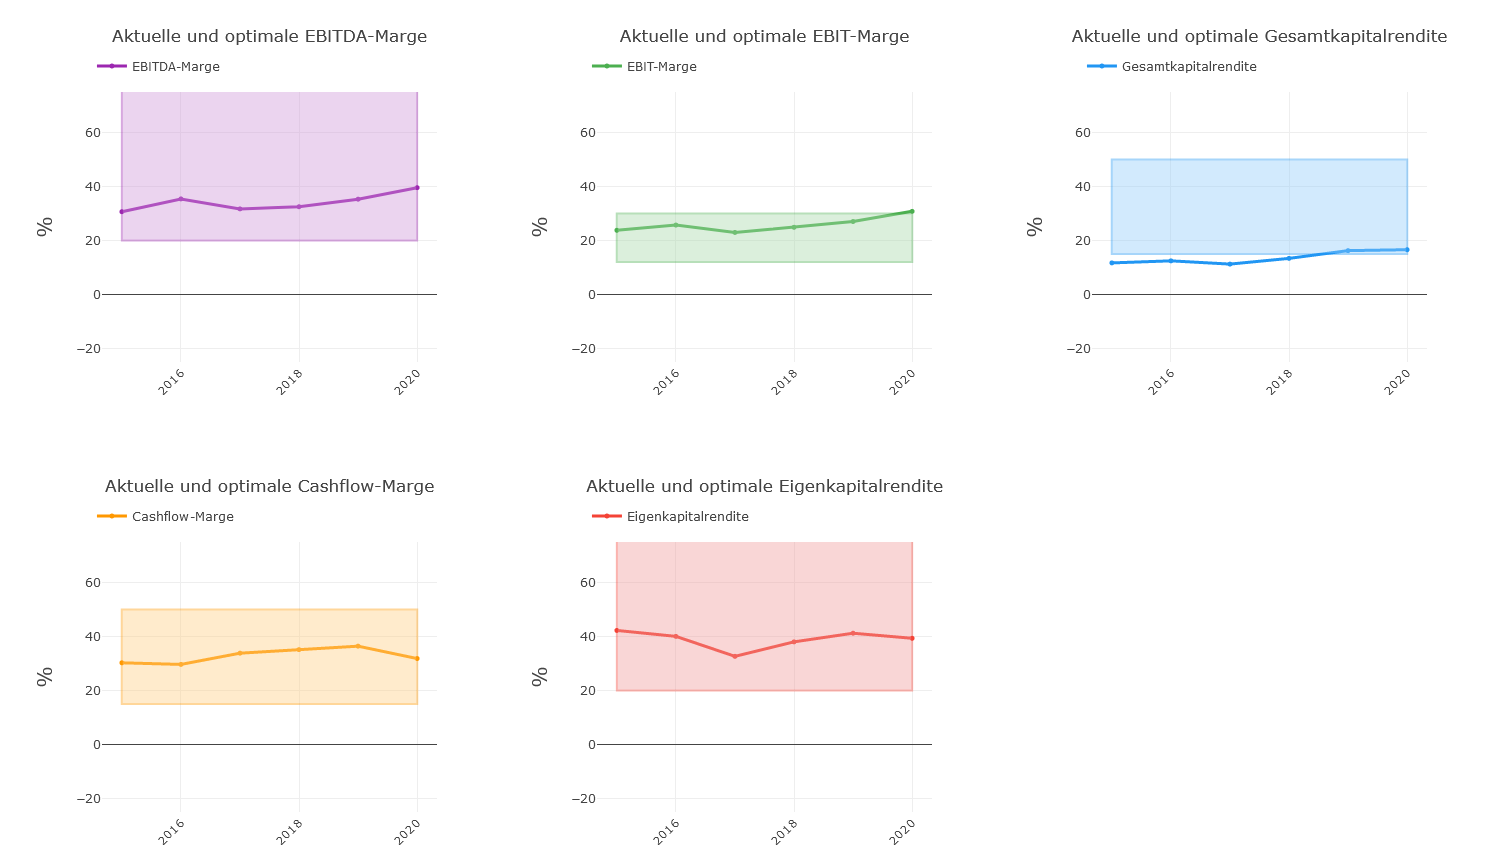
Margins Roche
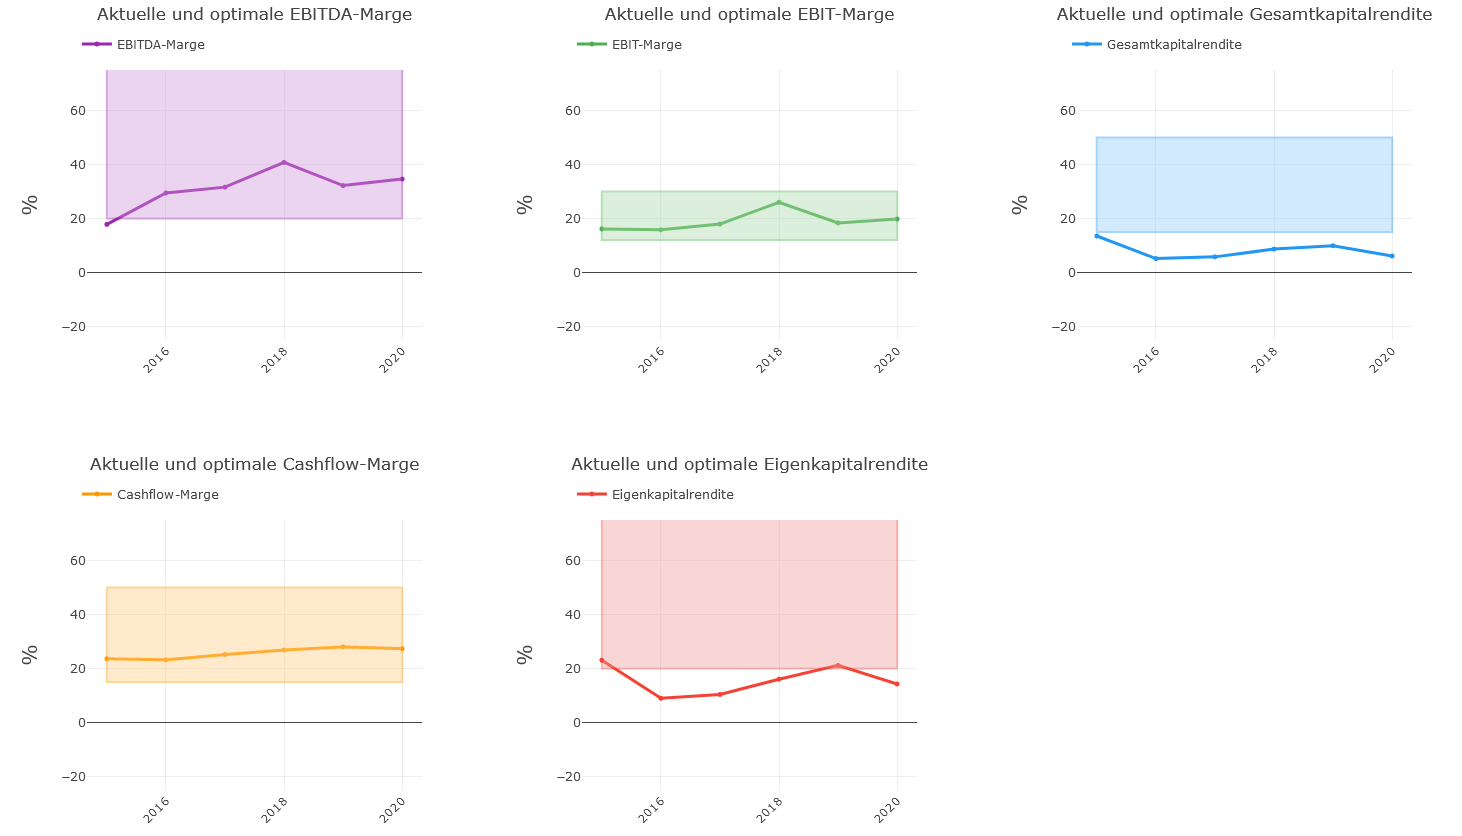
Margins Novartis
Ready for Better Investment Decisions?
Start your free trial today - stock analysis with artificial intelligence.
Full Transparency | Full Access | Cancel anytime
The stability is also evident in the margins. Over the years, hardly any change in margins can be seen and they are mostly in the color-marked, statistically optimal ranges for solid and stable price gains. However, Roche has the edge here. Because not only are the margins even more stable, they are also in a clear sideways to slight upward trend. At Novartis, minimal weaknesses have been recognizable since 2018 with a slight downward trend. In particular, the return on equity and total capital falls compared to Roche and can no longer establish itself in the optimum above the 20% mark. Slight losses are also noticeable in EBIT(DA). The weaknesses are minimal and leave no doubt about Novartis as an investment, but Roche simply shows a little more consistency in recent history.
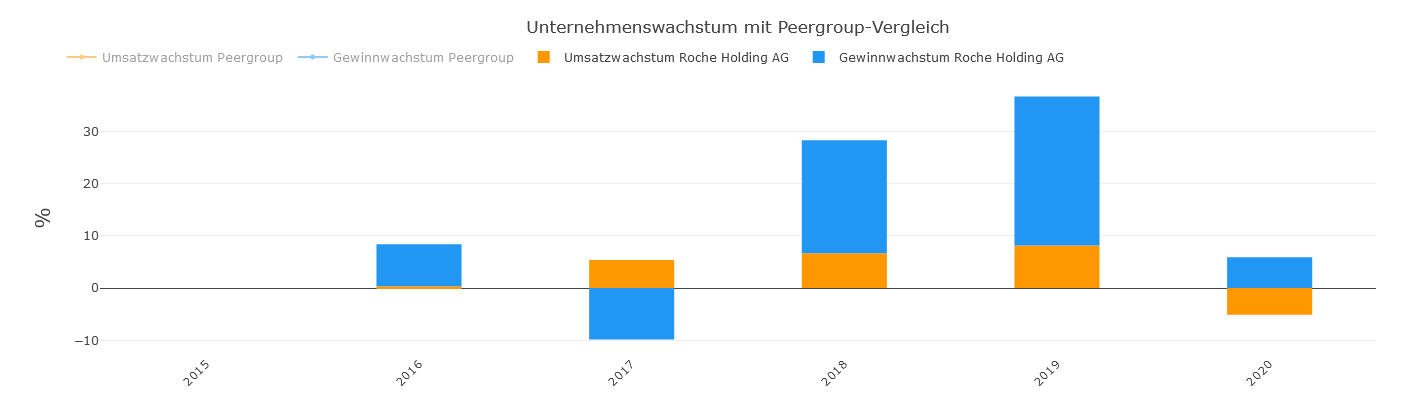
Roche Growth
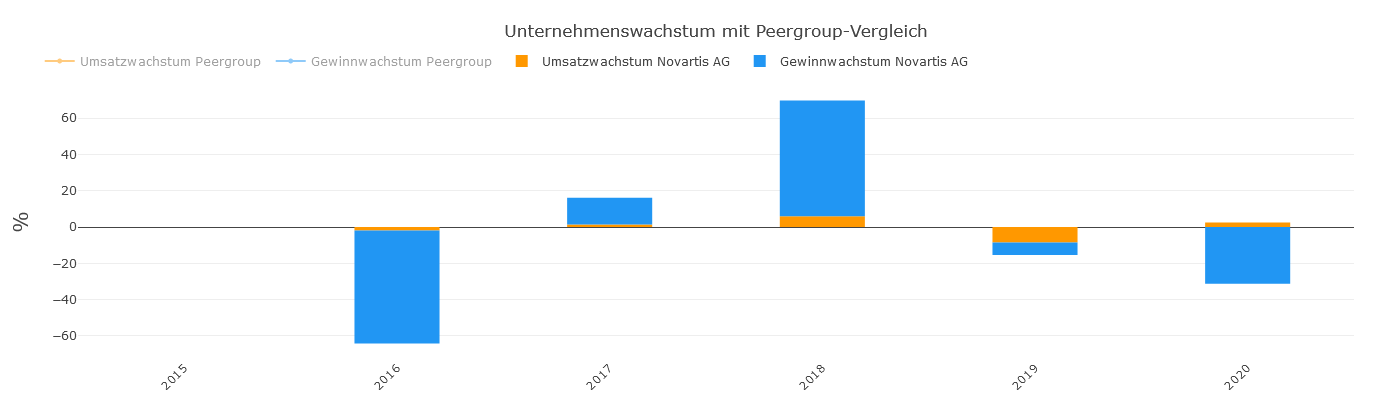
Novartis Growth
Somewhat clearer weaknesses of Novartis are evident in growth. Apart from a massive boost, sales and profit tend to be slightly declining and had to experience a significant profit slump in 2016. Roche, on the other hand, presents itself in this area as well with impressive consistency and partly strong growth for such an established company. A slight profit decline was reported in 2017 and last year sales shrank slightly. Nevertheless, profit could also be increased last year.
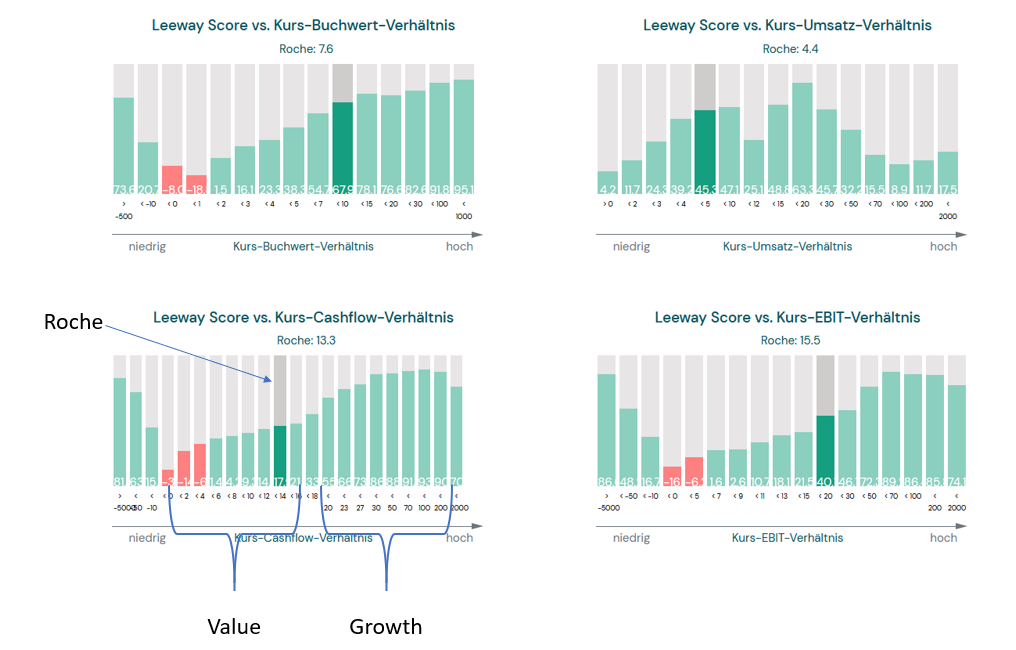
In terms of valuation, Roche positions itself neutrally in the middle. For an optimal valuation in the momentum/growth environment of recent years, it is not expensive enough. Therefore, it does not suffer from a reallocation towards value either. On the other hand, Roche is also not so cheap that one would have to describe it as strongly undervalued. With Roche, one moves at the upper end of the range for a value company and at the lower end for growth companies and is thus comparatively independent of paradigm shifts of this kind.
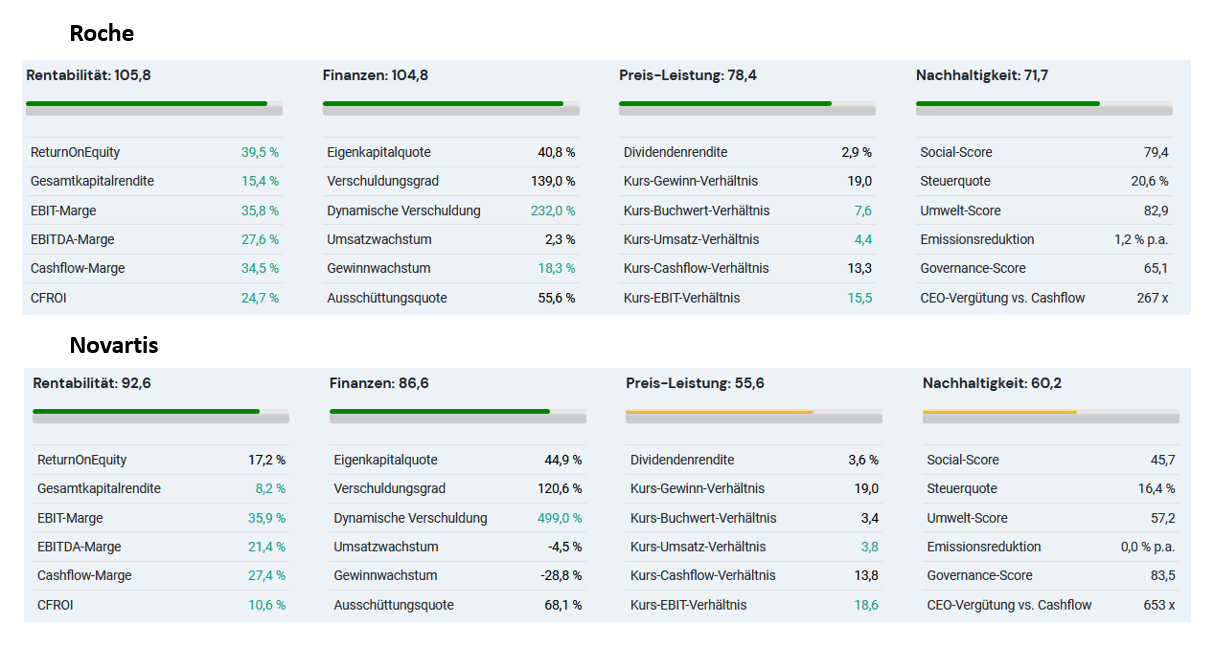
Conclusion: Both Novartis and Roche are good companies for stable profits. All in all, however, Roche has a slight edge. A fact that is also expressed in our algorithmic overall rating. Roche achieves an overall rating of 84.9 points (as of May 30, 2021), Novartis only 70.7 points. Here, 0 points correspond to a neutral rating, i.e. performance like the market average. Accordingly, Novartis's 70 points are very good, but almost 85 points are absolutely top-notch. Novartis is slightly weaker in all areas. In margins, the return on equity is weakening, in finances the growth, and in the "price" category Novartis is simply a little too cheap not to raise slight question marks. In addition, the dividend yield at Roche is a little lower. With Swiss companies, a low dividend is always nicer, because the high withholding tax otherwise forces one to make complex reclaim applications. Even nicer, however, would also be statistically a dividend yield of less than 2%. In the long term, it is more profitable if companies invest their profits in themselves rather than distributing them.
All data and graphs shown and much more can be found on the detail pages for Novartis and Roche.
Lars Wißler owns shares of Roche. PWP Leeway does not own any of the mentioned stocks.